O-Solution Sound and Vibration Analysis System (Software)
O-Solution
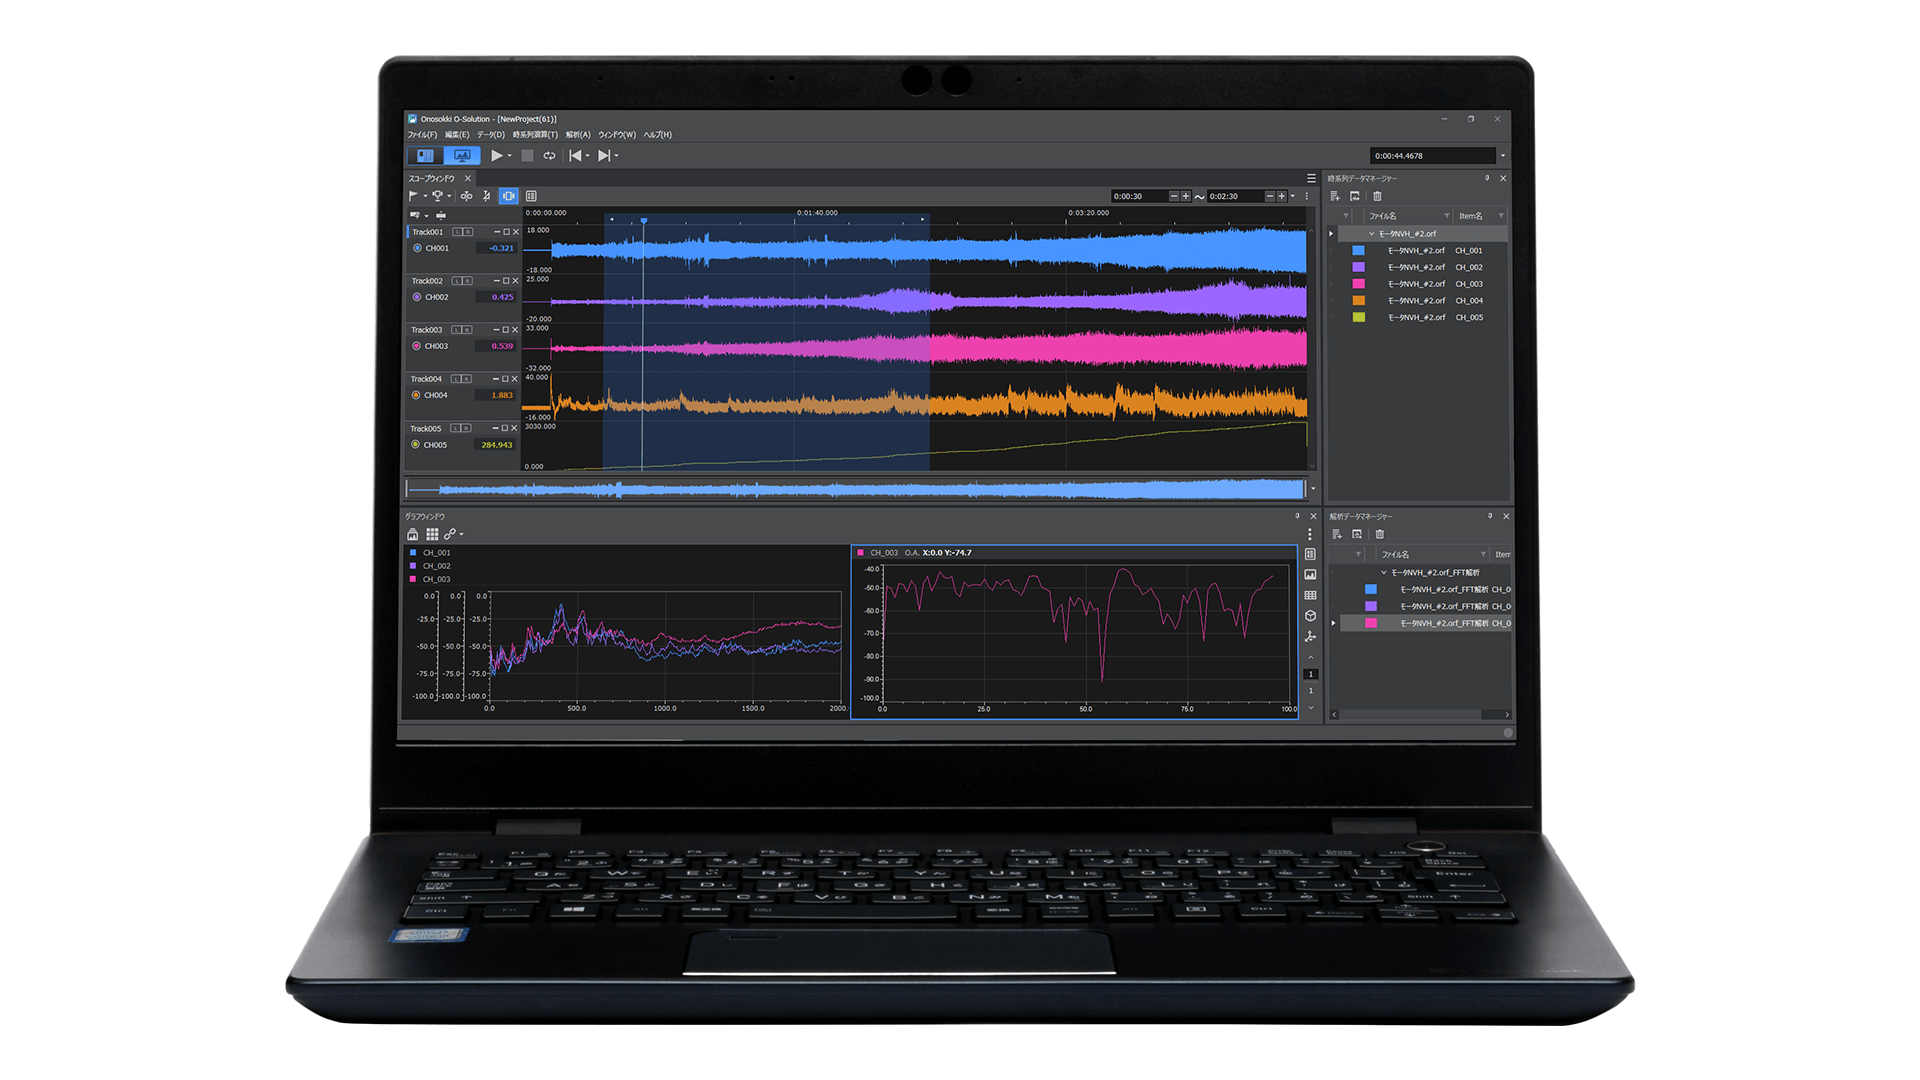
O-Solution is software that makes it easy to compare and perform various analyses on large volumes of time-series data.
In addition to frequency analysis such as FFT analysis, FFT tracking analysis, and octave analysis, it also incorporates various functions such as digital filters.
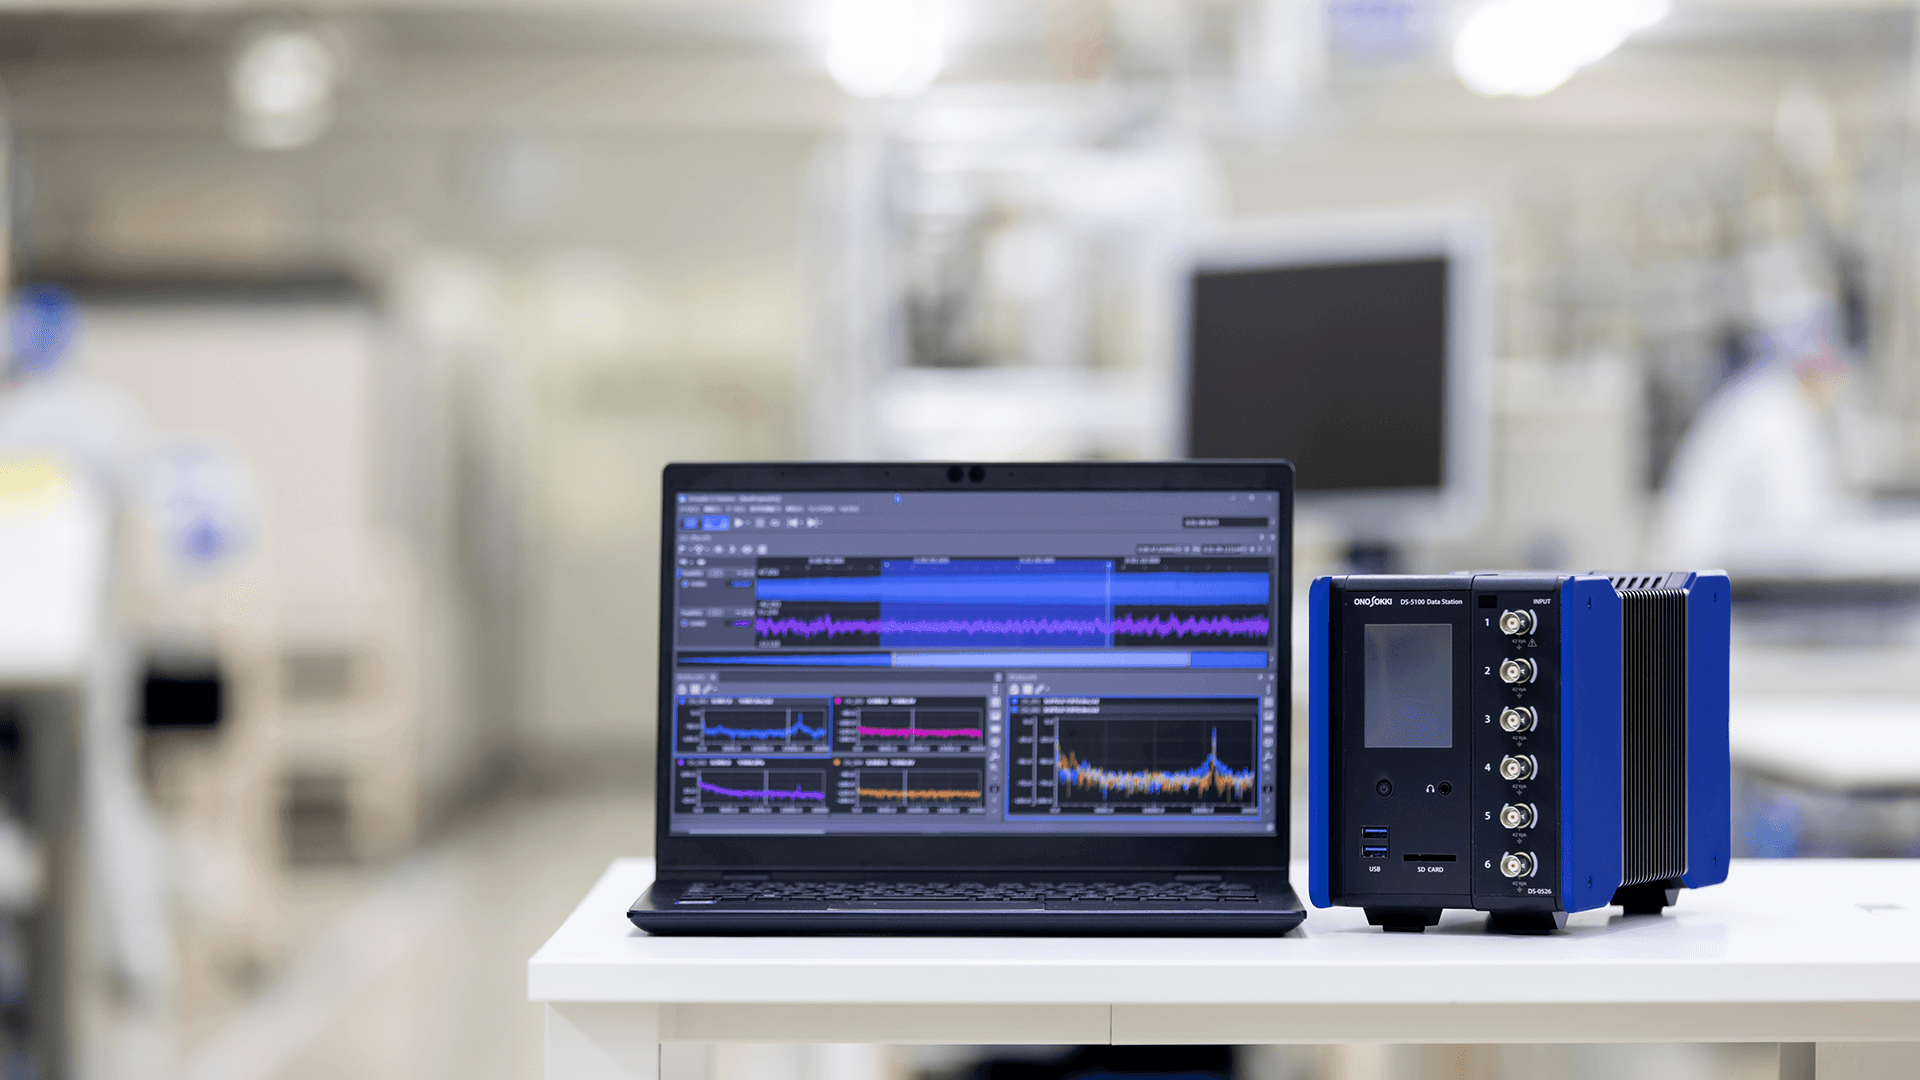
Furthermore, when used in conjunction with the DS-5000 data station, it enables smooth real-time measurement and analysis, contributing to increased efficiency in measurement work.


