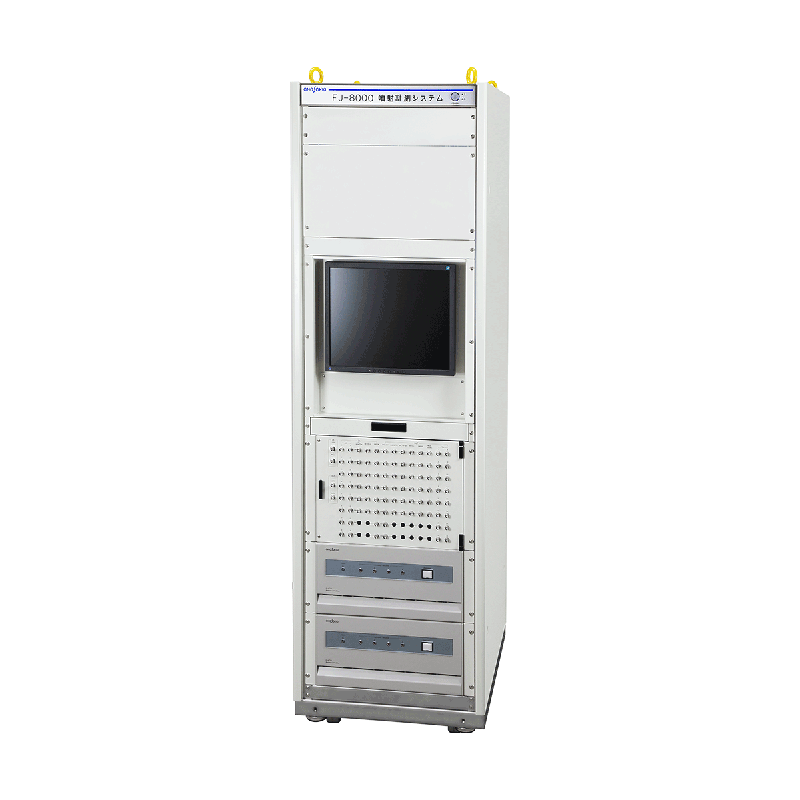
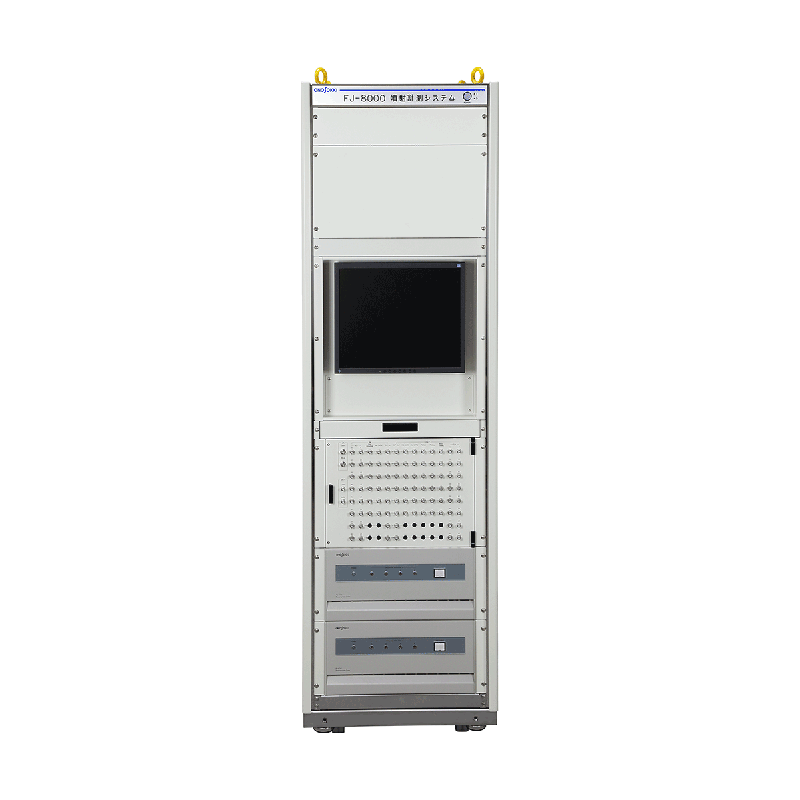
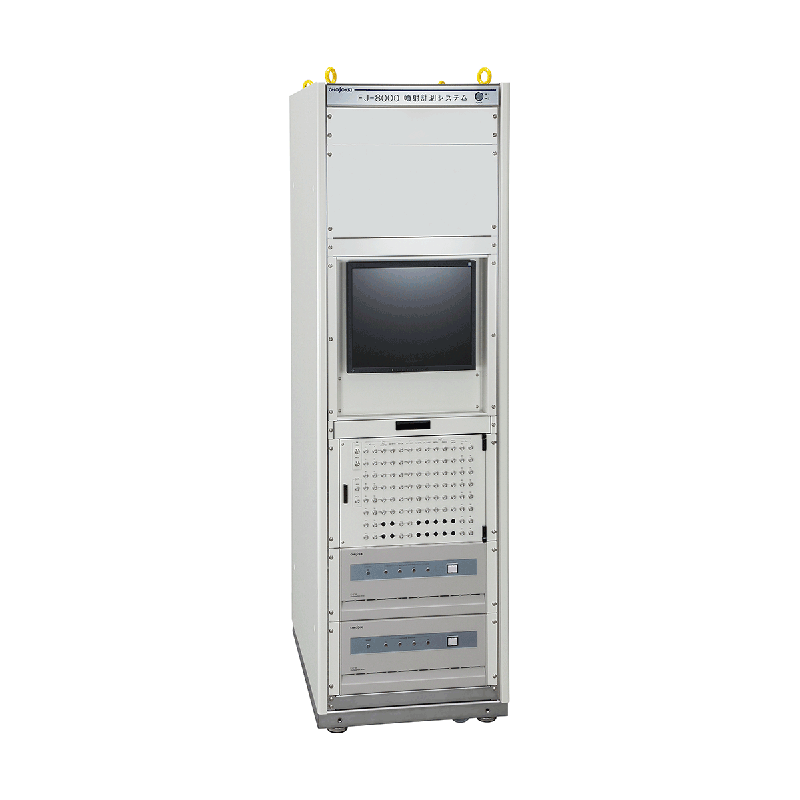
Multi-stage injection volume measurement system
FJ-8000シリーズ


Reducing NOx and PM emissions, improving fuel efficiency, and minimizing vibration and noise – by visualizing the injection state of common rail systems, we can develop engines with reduced environmental impact.
The FJ-8000 series is a multi-stage injection volume measurement system that can measure injection volume, injection rate, injection timing, and injection duration in a common rail system under injection conditions close to those of a real vehicle.
By further improving injection precision and achieving near-complete combustion, it becomes possible to suppress PM and NOx emissions, leading to improved fuel efficiency and reduced vibration and noise.
-

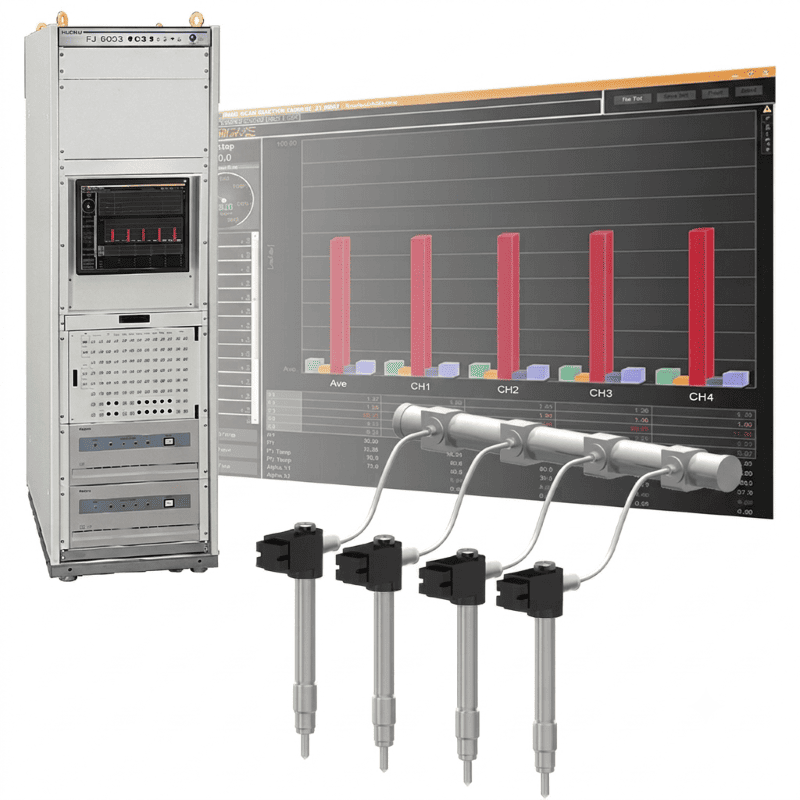
Example of a 6-cylinder layout (supports up to 8 cylinders)


1. Bar graph
The amount of fuel injected for each cylinder and injection stage is displayed as a bar graph.

2. Injection Rate Monitor
Displays injection rate, pressure, and external input signals (injection commands, etc.) for one channel simultaneously. Supports overlaying with saved data.

3. Trend graph
Up to 8 types of data, with 3000 cycles, are displayed in a trend format.
4. Dual Monitors
Display trend graphs and bar graphs simultaneously.
5. Numerical Monitor
The system displays numerical values for each cylinder, including injection volume, injection duration, and temperature inside the detector.


