XN-8000 Frequently Asked Questions
Question number FAQ-1101
How to read saved files (import)
The ".dat" file format saved by the XN-0821 FFT analysis software's "Export" function is the standard file format for general-purpose FFT analysis using devices such as the DS2000 series data stations, CF-7200 portable 2ch FFT analyzer, CF-3600 portable 4ch FFT analyzer, CF-5220Z 2ch multipurpose FFT analyzer, and CF-4220Z 1ch general-purpose FFT analyzer. Therefore, ".dat" files saved by these devices can be imported, excluding special measurement data such as data in the 100kHz frequency range and log sweep data. In addition, "*.csv" files saved by the XN-0821 FFT analysis software, "*.txt" files saved by the DS-2000, and tracking data ".trc" files can also be imported.
■ Procedure for "Insert → Import"
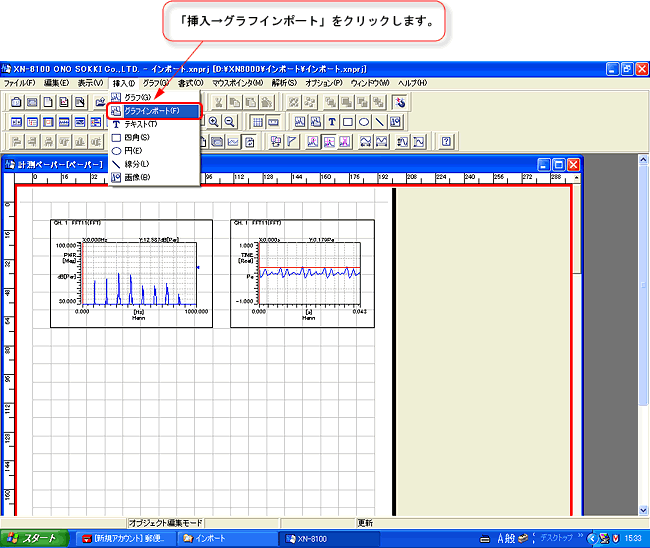
- Click "Insert → Import Chart" (Figure 1).

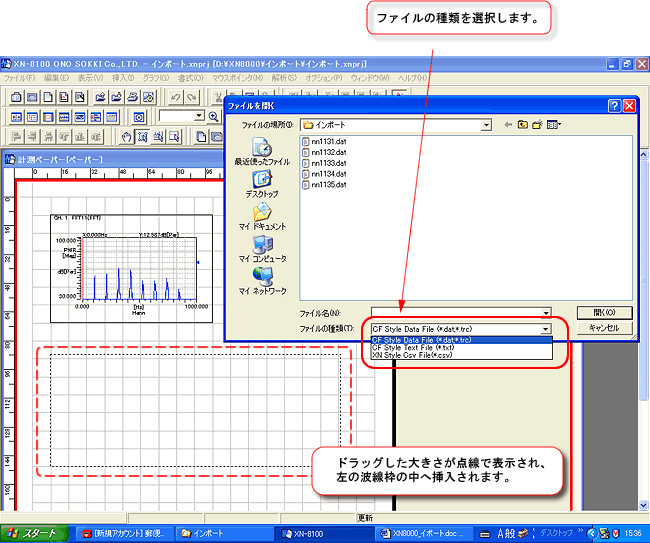
Figure 1 - Drag to the desired size for the graph. A dotted graph frame will appear, and the "Open File" dialog box will open (Figure 2).
- Select "File type: CF Style Data File (*.dat *.trc)"
- Select the files you want to display. If you want to open multiple files, you can select them by holding down the Shift key while clicking.

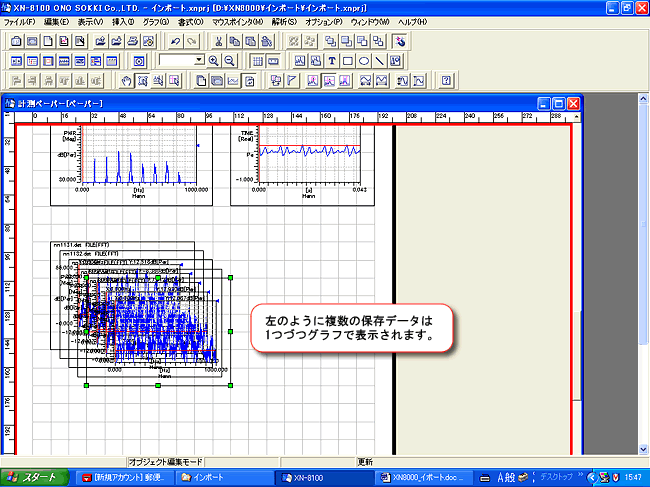
Figure 2 - Clicking the "Open" button will insert the selected data graph. Figure 3 shows the screen immediately after opening multiple files.

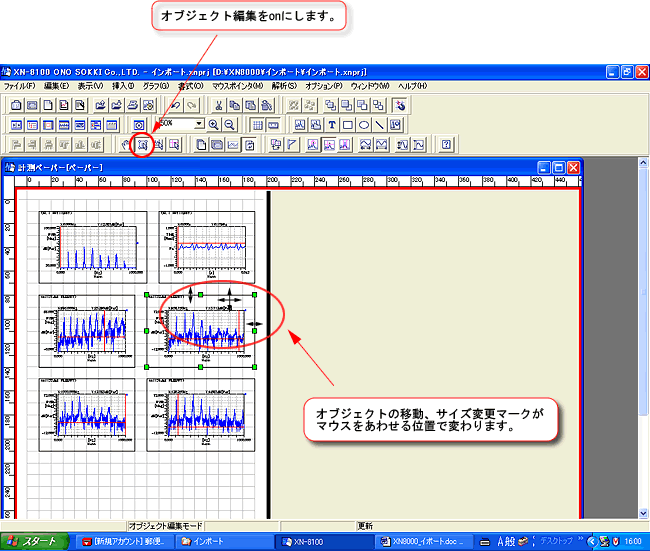
Figure 3 - You can adjust the layout by moving and scaling the graph (Figure 4).
With the [Object Editing] button turned on, click on the graph. The selected graph will become active and its border will turn green. When you hover your mouse over the graph, a crosshair will appear. You can move the graph by dragging it. Also, when you hover your mouse over the green border, up/down and left/right arrows will appear, allowing you to zoom in and out. The file name will be displayed at the top of the graph.
Figure 4
■ Procedure for "Graph → Import"
You can import saved files into the currently displayed graph and overlay them. For example, by importing saved power spectrum data into a power spectrum graph and overlaying it, you can compare spectra. Only waveform data of the same type can be imported. If you only want to import saved data, import one data file using the first method.
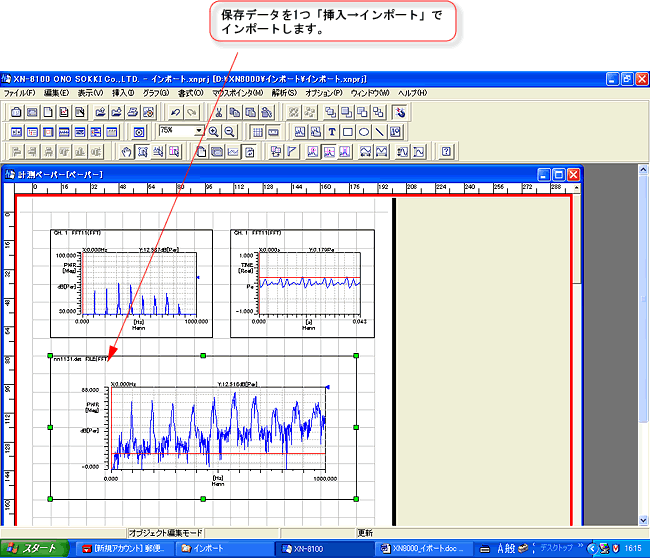
- First, import the data you want to display using the "Insert → Import Chart" method (Figure 5).

Figure 5 - Click the imported graph to activate it.
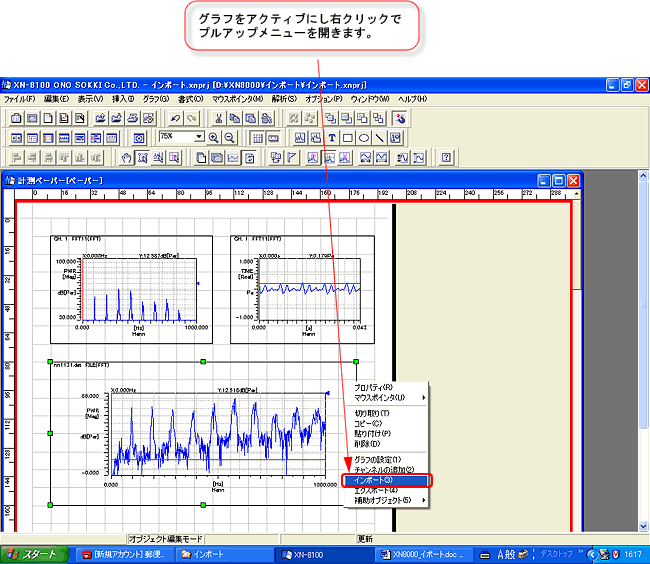
- Hover your mouse over the active graph and right-click to open the pull-up menu (Figure 6).

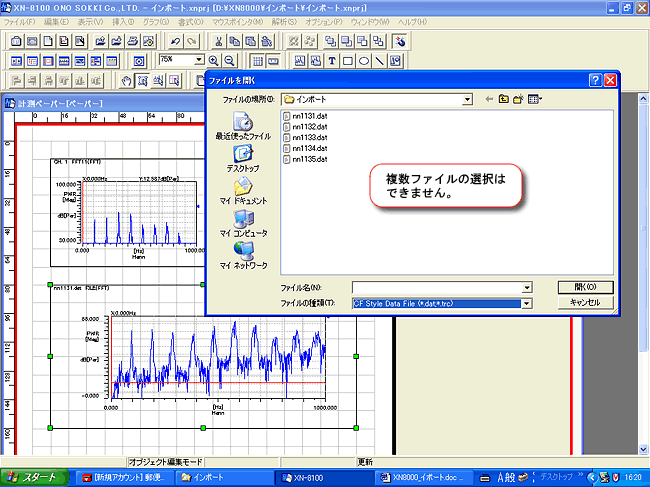
Figure 6 - Click "Import" in the pull-up menu. The "Open File" dialog box will open (Figure 7).

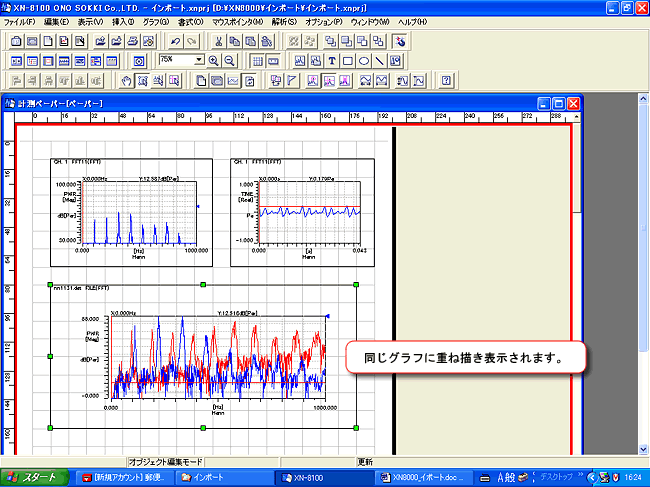
Figure 7 - Select a file and click the Open button. Multiple files cannot be selected here. The selected file will be displayed as an overlay (Figure 8).

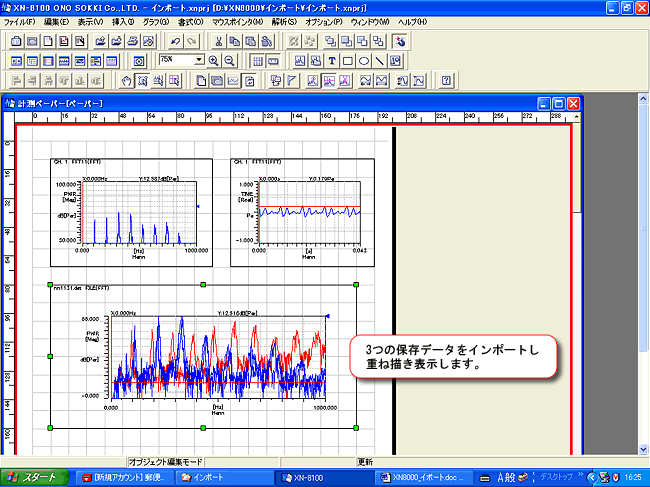
Figure 8 - Open the next file using the same procedure as in step 5 above, and display it with the overlays (Figure 9).

Figure 9 - This will make the graph easier to read.
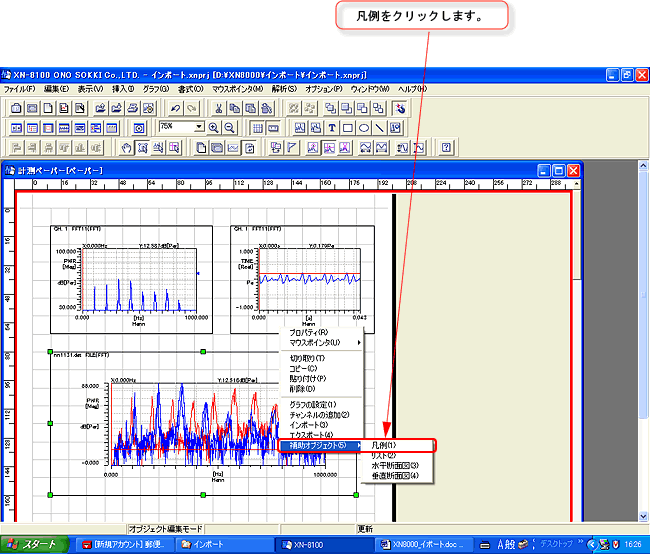
- Right-click the graph to open the pull-up menu.
- Select the auxiliary object and click the Legend (Figure 10).

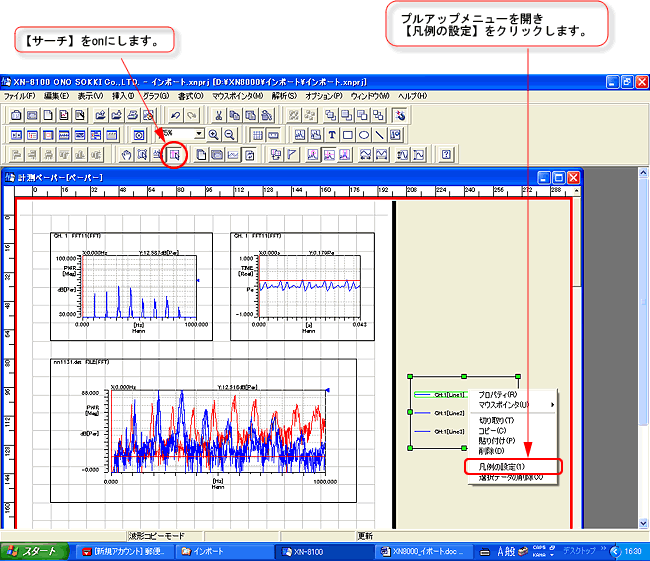
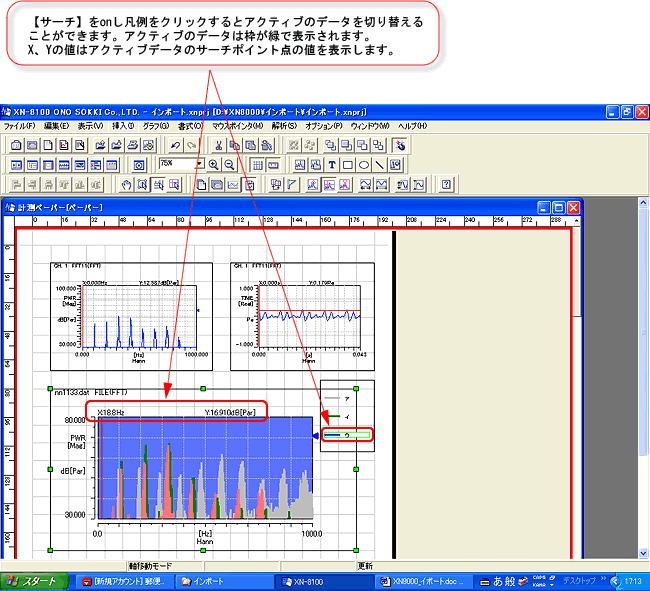
Figure 10- Turn on the [Search] button (Figure 11).
- Click on "Legend" to activate it. The border will turn green.
- Next, right-click on "Legend" to open the pull-up menu and then open the "Legend Settings" dialog box. (Figure 11)

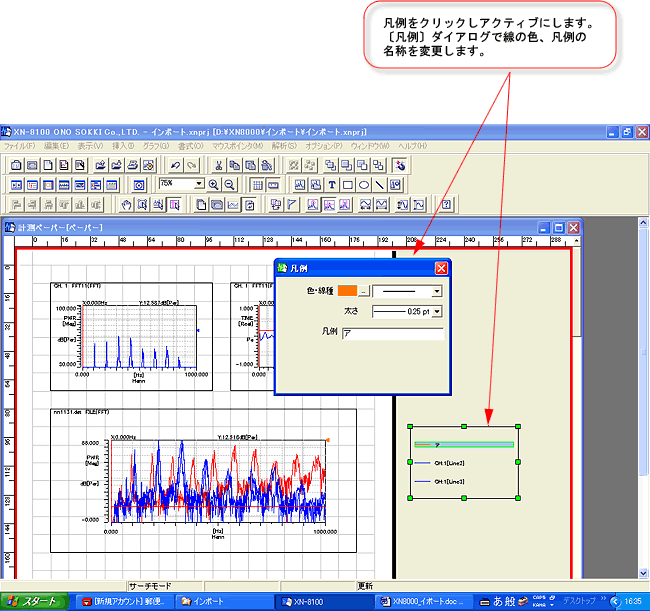
Figure 11- Click CH1 (Line1) in the "Legend" to activate it. The border will turn green. Set the "Color/Line Type" and "Legend" items in the [Legend] dialog box (Figure 12).
- Click Line2, which is next to "Legend," to activate it. Edit it using the same procedure as above. Do the same for the other lines.

Figure 12- Turn on the [Edit Object] button (Figure 13).
- Click the graph to activate it.
- Double-click the graph, or right-click and select "Graph Settings" from the pull-up menu to open the graph properties.
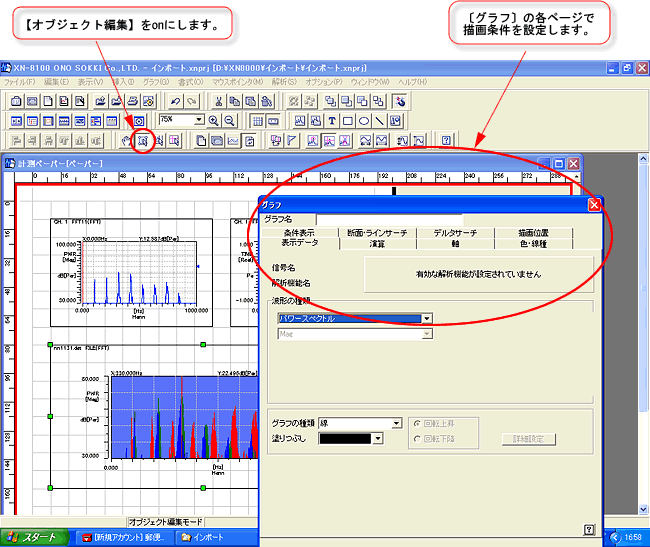
- Set the graph to an easy-to-read format, such as "Y-axis upper and lower limits: customizable" on the [Axis] page, "Graph type: Line" on the [Display Data] page, and "Drawing color: customizable" and "Active signal: customizable" on the [Color/Line type] page (Figure 13).

Figure 13- Right-click the graph, click "Properties" in the pull-up menu that appears, and open "Paper Object." Set the "Font Size: Customizable," etc.
Figure 14 shows an example of the power spectrum for the sounds "A," "I," and "U."

Figure 14supplementary explanation
- Clicking a line in the legend activates that data. When data is active, the color specified in "Active Signal: Custom Setting" takes precedence over the color set in "Legend." In the example in Figure 14, "U" is active.
- The [Insert] button allows you to insert text, images, and other elements in addition to importing graphs.
Last updated: 2006-11-20