

DS-2000 Frequently Asked Questions
Question number FAQ-0720
Calculate and display the synthesized acceleration derived from the acceleration measured by a 3-axis accelerometer.
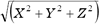
If the measured accelerations along each axis of a 3-axis accelerometer are denoted as X, Y, and Z, the resultant acceleration can be calculated using the following formula.

In the case of power spectra, calculations are performed for each frequency component. Accelerations X, Y, and Z are measured simultaneously with ch1, ch2, and ch3, respectively, and the power spectrum data for each measurement is denoted as PWR1, PWR2, and PWR3. The composite acceleration for each frequency can be calculated using the following formula.

PWR1, PWR2, PWR3: Power spectra of ch1, ch2, ch3.
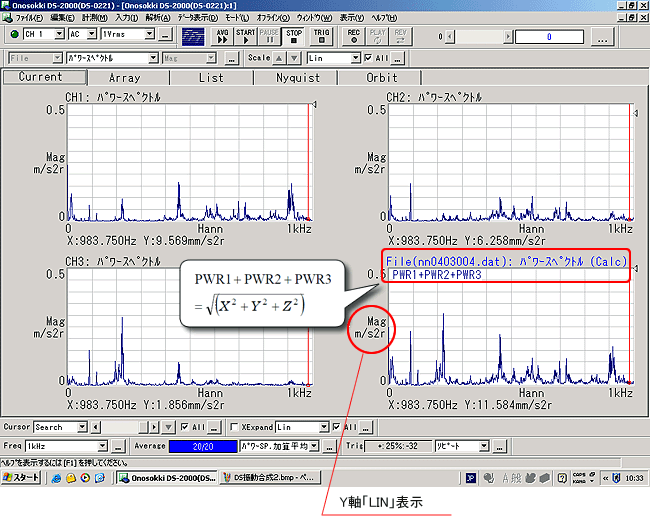
This example shows a four-screen display where screen 1 displays the power spectrum PWR1 for channel 1, screen 2 displays the power spectrum PWR2 for channel 2, screen 3 displays the power spectrum PWR3 for channel 3, and screen 4 computes and displays the synthesized acceleration for each frequency.
Measurement Example
- "Go to the 'Data Display → Layout Settings' page to set up a four-screen display. The display frames are arranged as follows: Screen 1 in the top left, Screen 2 in the top right, Screen 3 in the bottom left, and Screen 4 in the bottom right."
- Display the power spectra PWR1, PWR2, and PWR3 for channels ch1, ch2, and ch3 on screens 1 to 3.
- Click on the data area of screen 4 to make it active (the data text will turn blue).
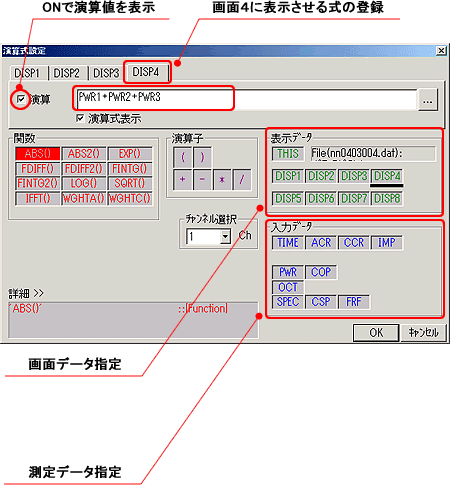
- Open the "Analysis → Expression Settings" page, create the following expression on screen 4, check the box for "Calculation" and click the OK button to execute the calculation, which will be displayed on screen 4.
Note that the Y-axis scale will be set to "LIN."
Calculation Expression Setting Screen
Display of calculation results
Supplement "In the case of saved data"
If spectral data for each axis is measured and saved using a single-axis acceleration pickup, the power spectral data for the X, Y, and Z axes can be called up on data positions (display frames) 1, 2, and 3 respectively, and similar calculation displays can be performed by executing the following calculation formula.

Memo
Power spectrum data stores the square value of amplitude A (RMS), and based on this value, when the Y-axis scale is log, it displays 10logA 2, and when it is LIN, it shows √A2.
The above calculation performs the following computation.
● When the Y-axis scale is LIN
X, Y, Z: Power spectrum of the same frequency.
●When the Y-axis scale is logarithmic

Last updated: April 16, 2007