

DS-2000 Frequently Asked Questions
Question number FAQ-0663
How can meaningful values in terms of sound pressure (Pa) be obtained when observing the AC output of the sound level meter with the time waveform of the DS-0221?
For example, input the CAL signal of 94dB from the sound level meter and perform calibration using the unit calibration function so that the power spectrum is 94dB. However, when displaying the time waveform afterwards, a large value is shown.
By using the calculation function to multiply the time waveform by 20×10-6, it can be displayed in sound pressure units of Pa.
Next, I will explain the meaning and calculation method of unit calibration for DS-0221. The same applies to the CF series.
Please read the explanation comparing the time-domain waveform (single amplitude value) and the effective value, sound pressure level dB, and pressure (Pa). (The effective sound pressure value displayed in dB is referred to as the sound pressure level.)
For the sake of explanation, the effective value will be denoted with a lowercase "r" as a subscript after the unit.
| Example of notation | |
| Vr: Effective value of voltage | V: instantaneous voltage (peak amplitude value) |
| Pressure: Effective Pressure Value | Pa: instantaneous pressure (peak amplitude value) |
(1) sound level meter CAL Signal
When the sound level meter is set to the 100dB range with a flat frequency weighting and the CAL button is turned on, a signal of 94dB is output from the AC terminal. This waveform is shown in Figure 1. Figure 1 is calibrated with the DS-0221 unit calibration function, and although the time axis of the waveform has very large values, the power spectrum matches the 94dB value of the sound level meter. I will explain the reasons for this in order.
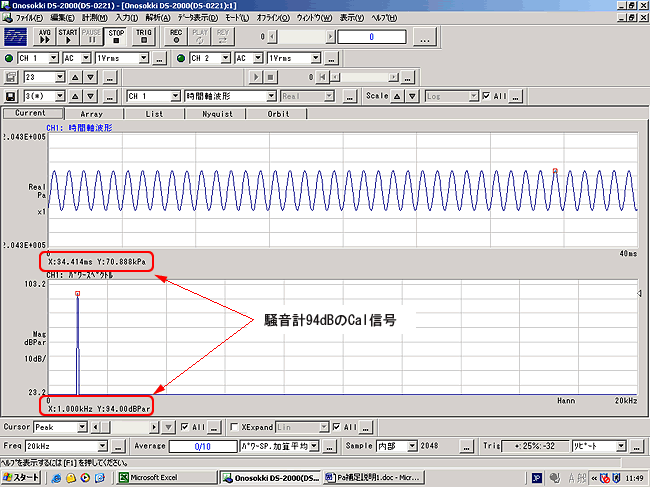
Figure 1: Top: Time waveform, Bottom: Power spectrum (unit calibration)
(2) Sound pressure level (dB) and pressure (Pa)
The sound pressure level is defined by the following formula.
 | (1) |
(1) According to the formula, a sound pressure level of 94 (dBr) corresponds to 1 (Par). It is important to note that the sound pressure level of 94 (dBr) and 1 (Par) are generally taken as effective values. The ACout signal from the sound level meter can be considered as a "voltage signal proportional to pressure changes" as a sound pressure sensor. Absolute pressure measurement is not possible. The time waveform in Figure 1 is thought to represent the waveform of instantaneous pressure changes.
(3) Power Spectrum
The power spectrum is represented by the effective amplitude obtained from a sample size of 2048 points (it is possible to display the half-amplitude value depending on the settings).
Figure 2 shows the voltage value data before calibration. The power spectrum is displayed in LIN format for easy reading in voltage. Since the signal is a sine wave, the effective value of the time waveform can be read from the 1kHz value of the power spectrum, but generally, we look at the overall, which can be read as "0.347Vr" from Figure 2.
From what has been stated so far, we can understand the following. This sound level meter shows that at a sound pressure level of 94 dBr, the pressure change is 1 Par, and at this point, the effective voltage is 0.347 Vr.
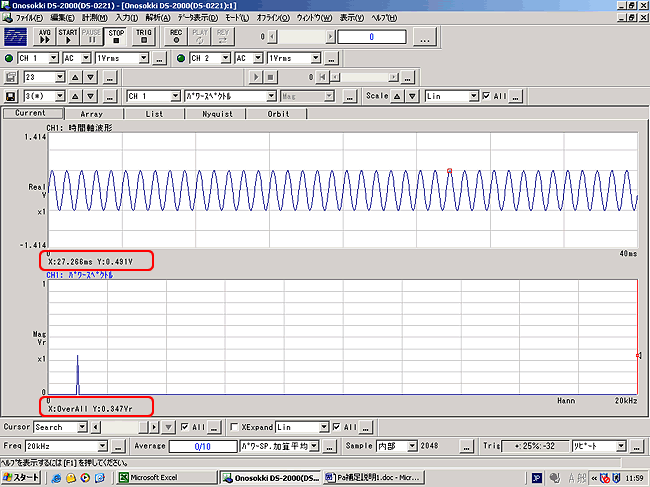
Figure 2
(4) Time Axis Waveform and Effective Value
In Figure 2, the amplitude of the time waveform (peak amplitude value) can be read as 0.491V. The power spectrum displays an effective value of 0.347Vr. For a sine wave, the effective value and peak amplitude value have a relationship of √2. Since the Cal signal is a sine wave, 0.491 ÷ √2 = 0.347Vr, indicating that 0.491V and 0.347Vr mean the same thing. Conversely, 1Par corresponds to 1.414Pa (peak amplitude value), so it can be understood that when the amplitude of the CAL signal is 0.4907V, it results in 1.414Pa. Therefore, 1 ÷ 0.347 = 1.414 ÷ 0.491 = 2.88 (Pa/V) becomes the conversion factor from voltage to pressure.
DS-0221 unit calibration
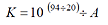
From (3), when the voltage is 0.347Vr, it is displayed as 94dBr. By deriving the coefficient from equation (1), this becomes the conversion coefficient k (EU/V) from effective voltage A to sound pressure level B (dB). Applying this to equation (1) yields the following expression.
 |
In DS-0221, only one constant (EU/V) can be set, so since Po is also a constant, we can express K as K = k ÷ Po.
 |
Calculation example |
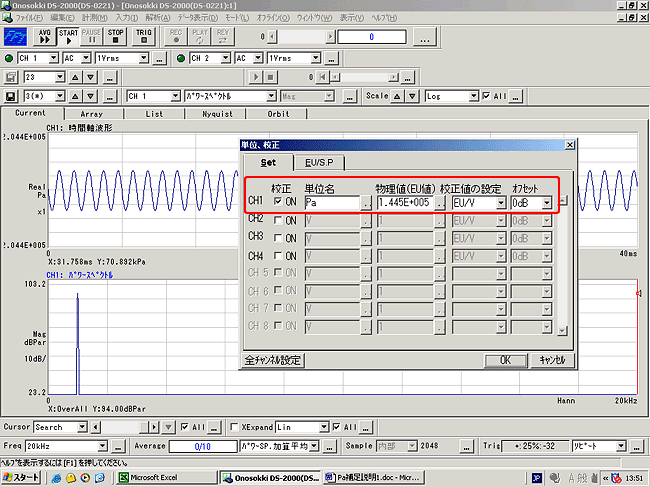
Figure 3
In Figure 3, the power spectrum is displayed on a sound level meter in dB units, but the time waveform is not in Pa units. To convert to Pa units, it is necessary to use a coefficient k.
 |
K is already set, so multiplying the time waveform by 20×10 −6 will convert it to Pa units. This will be executed using the computational function (Figure 4).
◆ Operation
Click on the time axis waveform to activate it.
Open the [Calculation Formula Settings] page from "Analysis → Calculation Formula." Write the calculation formula as shown in Figure 4, check the "Calculate" box, and click the OK button. The time axis waveform will be calculated using the formula.
"Change the Y-axis scale in the data display for better visibility."
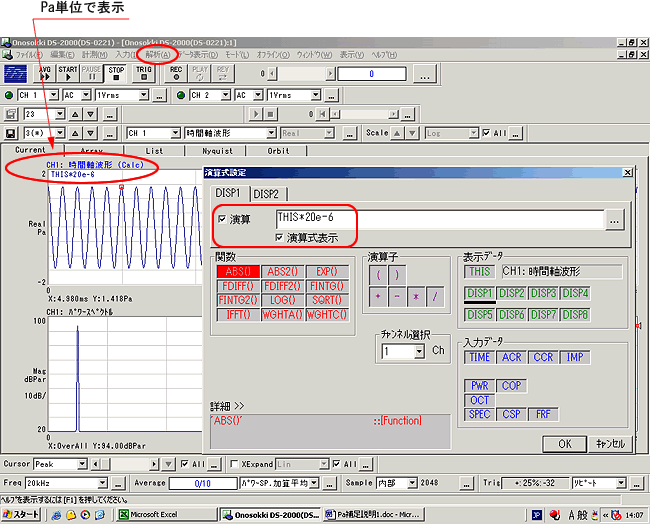
Figure 4
Figure 5 shows the signal measured with the sound level meter set to CAL 94dB. The time-domain waveform is displayed in Pascals (Pa), and the power spectrum is shown in sound pressure level in decibels (dB).
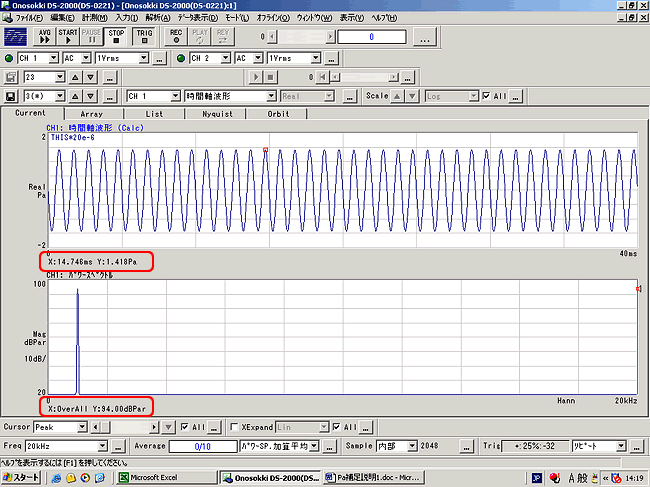
Figure 5
Supplement
The previous explanation was that the CAL signal was 94dB. If the sound level meter level range is, for example, 90dB, CAL becomes 84dB. Even when calibration at 84dB, you can read 94dB by replacing it with 84dB, and reading it exactly the same. After calibration the power spectrum to 84dB, multiplying the time-axis waveform by 20×10 −6 allows you to display the time-axis waveform in Pa.
Last updated date: 2006-10-23