

CF-7200 Frequently Asked Questions
Question number FAQ-0637
How to display tracking data (trc file) saved with CF-0722 tracking analysis software in 3D?
When saving data after tracking analysis using the CF-0722 tracking analysis software, it is saved in a file with the extension "trc" (hereinafter referred to as trc file). This data contains multiple spectral data measured during tracking, stored collectively. It is possible to read this data and display it in 3D. The operation is the same for both constant ratio tracking and constant width tracking trc files. In constant ratio tracking, the power spectrum has the X-axis as the order (ord), while in constant width tracking, it is frequency (Hz). This difference becomes clearer when displayed in 3D. Here, examples of each display are provided.
Furthermore, in the "tracking analysis using recorded data," it is possible to perform either constant ratio or constant width tracking analysis using the same data. This method is referred to as offline analysis, and for operational instructions, please refer to the separate PDF "CF-0722 Offline Tracking Analysis Simple Operation Manual."
Operation Procedure
- Please operate after loading the trc file. For information on loading trc files, please refer to "How to read tracking data (trc files) saved with CF-0722 tracking analysis software and analyze it with different conditions?".
- Click in the order of [MAIN] → [TRACKING] → [DISPLAY] → [3DON] to turn ON (light up) the 3D display function for tracking data. The spectrum saved in the trc file will be displayed. If the number of setting lines is 30, there is too much spectral data to display on one screen.
constant ratio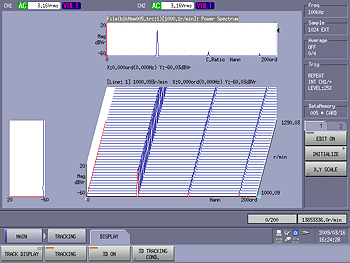 |
Fixed width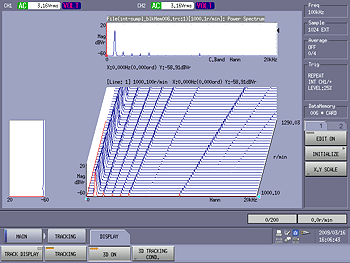 |
Click in the following order: [MAIN] → [TRACKING] → [DISPLAY] → [3D TRACKINGCOND] → [SET AUTO ON]. The number of lines displayed will correspond to the number of settings from trc:1.
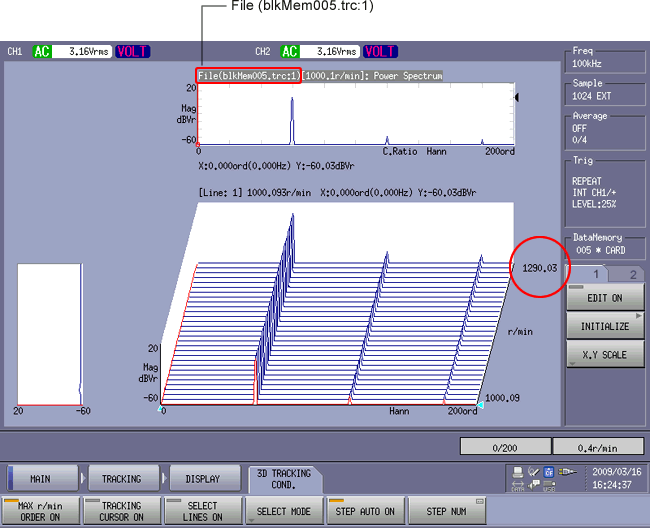
Click in the order of [MAIN] → [TRACKING] → [DISPLAY] → [3D ON], turn off [3D ON] once and then turn it back on to update the display. The measurement rotation range (in this case, 1000 r/min to 3000 r/min) will be optimized and displayed with reduced data.
About 3D operations.
To configure the settings for 3D display tracking, it must be done while the [3D ON] indicator is lit.
When changing the settings for [3D TRACKING COND], please be sure to perform the operation to update the display of [3D ON].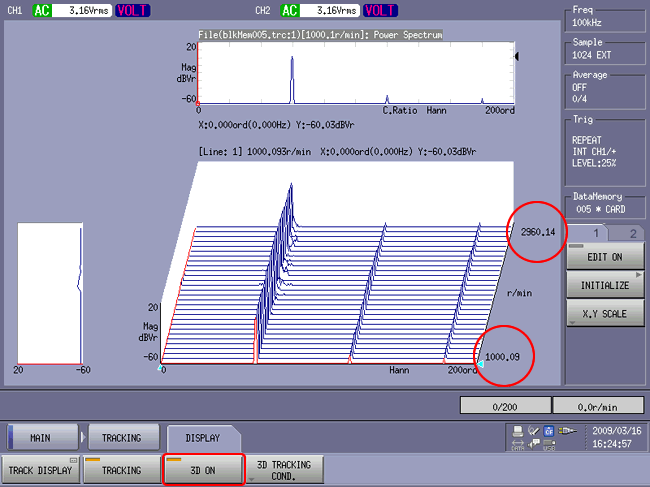
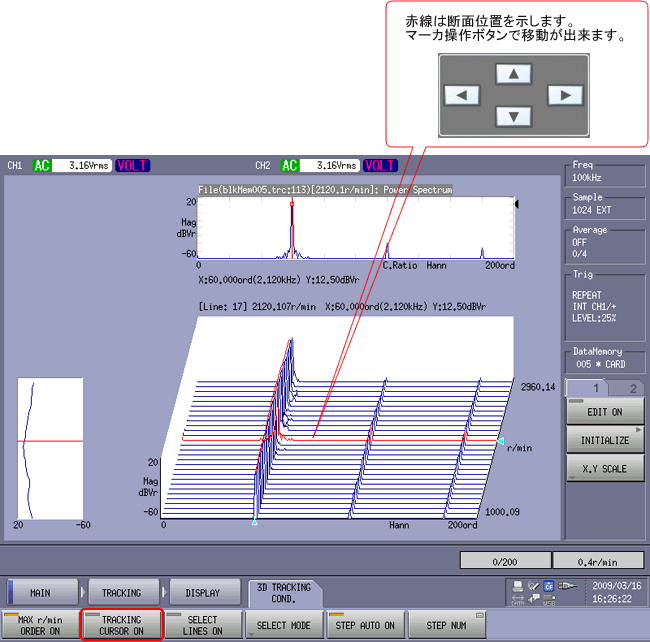
When [MAIN] → [TRACKING] → [DISPLAY] → [3D TRACKINGCOND] → [TRACKING CURSOR ON] is OFF (not lit), clicking on the data area will display the vertical and horizontal cross-sectional views at the top and left sides. Fine adjustments of the cross-section position (cursor marker) can be operated using the "SEARCH up, down, left, right" buttons.
Attention
- The power spectrum of the marker position will be displayed on the upper screen.
- The power spectrum on the screen can be saved as a TXT file using the SAVE operation of FFT analysis. However, it is not possible to save all spectra as TXT files simultaneously.
When 'TRACKINGCURSOR ON' is ON (lit), constant ratio tracking displays a longitudinal section with the same frequency as the marker point, while constant width tracking displays a longitudinal section with the same order as the marker point.
constant ratio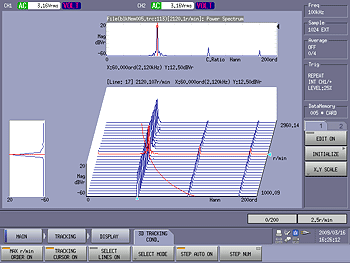 |
Fixed width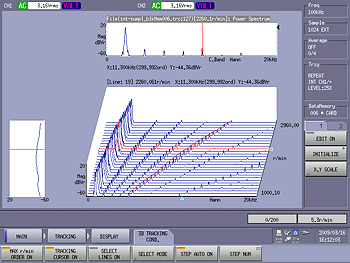 |
||
| vertical red line | Indicates the position of the same frequency as the marker point. The left figure shows the same cross-sectional data. |
vertical red line | Indicates the position of the same order as the marker point. The left figure shows the same cross-sectional data. |
| X-axis: | number of times | X-axis: | frequency |
Specify the range of rotation to be displayed.
It is possible to specify the range of display rotation and the range of block (trc) numbers. Here, we will take an example of setting the rotation range.
Click in the following order: [MAIN] → [TRACKING] → [DISPLAY] → [3DTRACKING COND] → [SELECT MODE] → [r/min]. Use the [UPPER] key to set the upper limit of the display rotation speed and the [LOWER] key to set the lower limit.
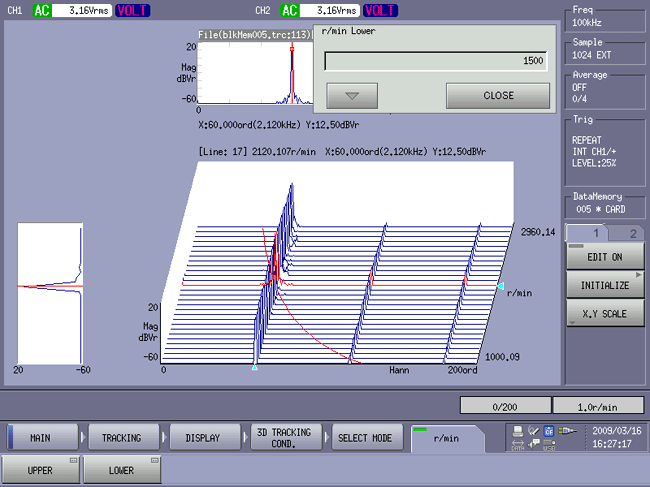
Click in the following order: [MAIN] → [TRACKING] → [DISPLAY] → [3DTRACKING COND] → [SELECT LINES ON] to turn it on.
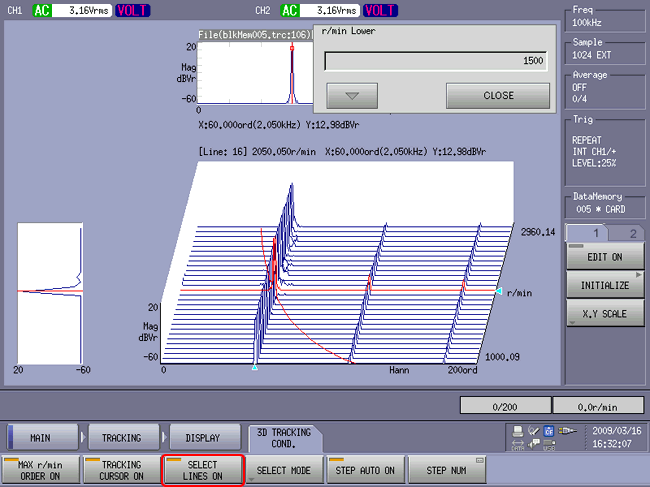
Click in the order of [MAIN] → [TRACKING] → [DISPLAY] → [3D ON], then turn off [3D ON] and turn it back on to update the display. It will be displayed within the specified rotation range (here, 1500 to 2000 r/min).
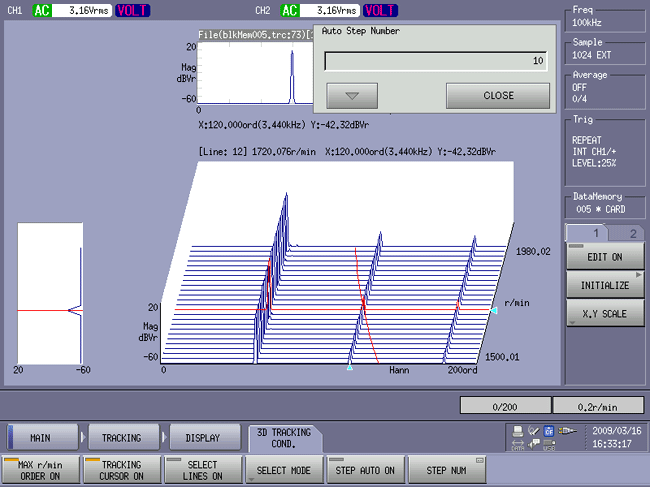
Invert 3D display
You can invert the display order of the drawing.
Click in the order of [MAIN] → [TRACKING] → [DISPLAY] → [3D TRACKING COND] → turn off the [MAX r/min ORDER ON] key. Then click in the order of [MAIN] → [TRACKING] → [DISPLAY] → [3D ON], turn off the [3D ON] key and then turn it back on to update the display.
constant ratio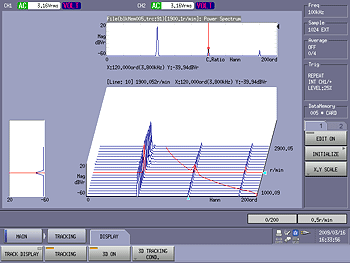 |
Fixed width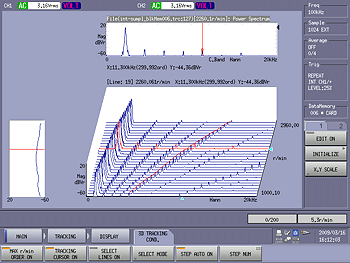 |
after the update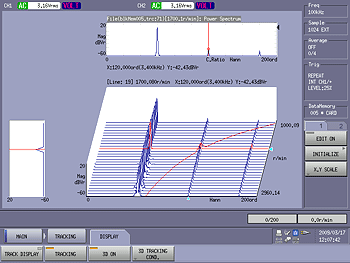 |
after the update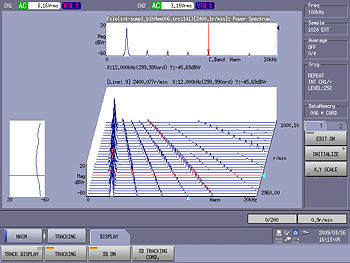 |
3D color display and line count change
Previously, it was operated within "MAIN ⇒ TRACKING ⇒ DISPLAY", but now it will be operated within "MAIN ⇒ DISPLAY". There is no need for display update operations; it will automatically update just by setting it. After operating within "MAIN ⇒ DISPLAY", you can return to "MAIN ⇒ TRACKING ⇒ DISPLAY".
Click in the order of [MAIN] → [DISPLAY] → [3D] → [SET 3D COND] → [DRAW], and turn the [DRAW] key ON (lit). This will display the colors according to the magnitude of the spectrum.
constant ratio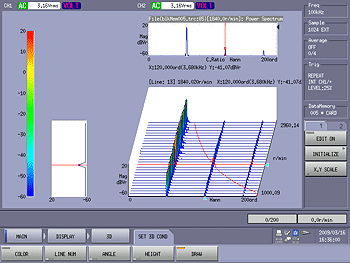 |
Fixed width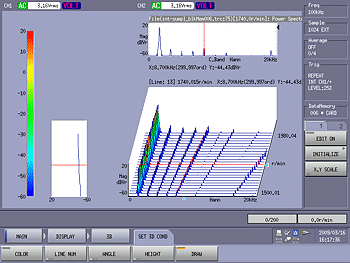 |
Click in the order of [MAIN] → [DISPLAY] → [3D] → [SET 3D COND] → [COLOR] and turn the [COLOR] key ON (lit). This will display the color spectrum.
constant ratio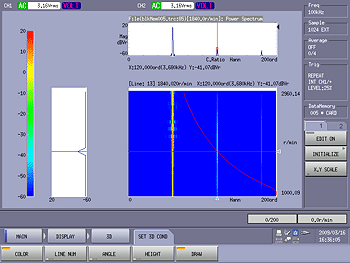 |
Fixed width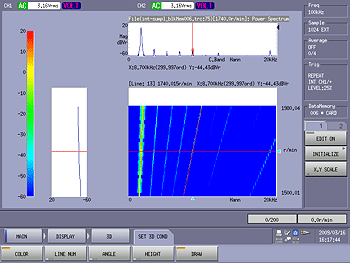 |
Click in the order of [MAIN] → [DISPLAY] → [3D] → [SET 3D COND] → [LINENUM] to switch the number of lines for 3D drawing among 10/20/30/50/100/200/400. In the display shown below, LINE NUM = 100 is selected.
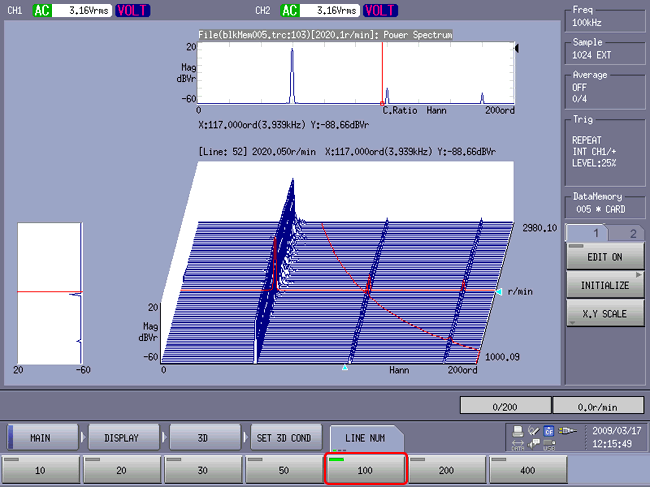
Change Color Scale
It is changed by setting the Y-axis scale arbitrarily. Click in the order of [MAIN] → [DISPLAY] → [X.Y SCALE] → [YAXIS] → [MANUAL] → [UP SCALE/LOW SCALE], and set the upper limit of the Y-axis scale with [UPSCALE] and the lower limit of the Y-axis scale with [LOW SCALE]. In the figure below, "20dB ~-60dB" is changed to "0 ~ -80dB".
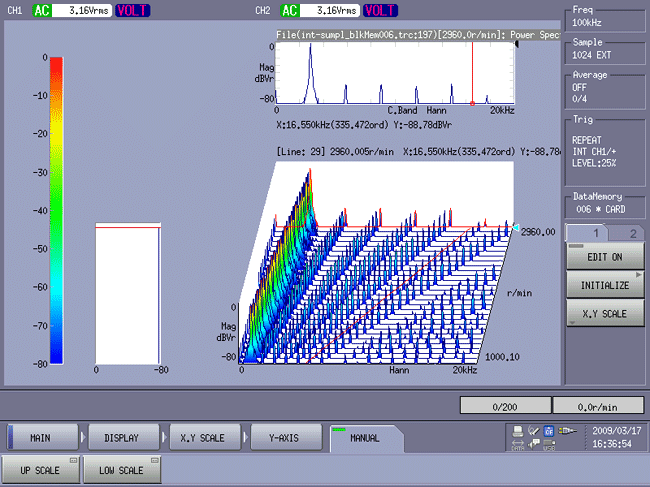
Last updated: April 20, 2009