

CF-3600A/3800A Frequently Asked Questions
Question number FAQ-0193
How to process data obtained from CF-3400 using Word or Excel?
When saving as a bitmap.
-
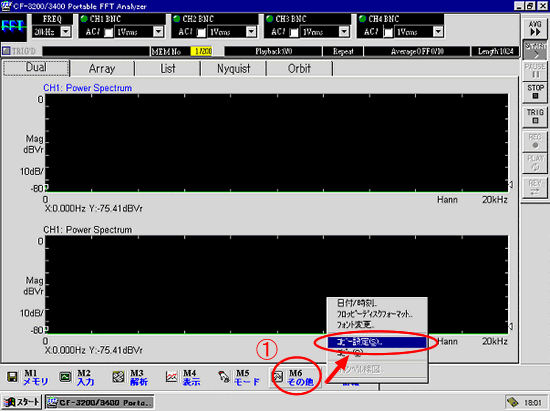
Click on 'Copy Settings' from the 'M6 Others' menu.
|
|
-
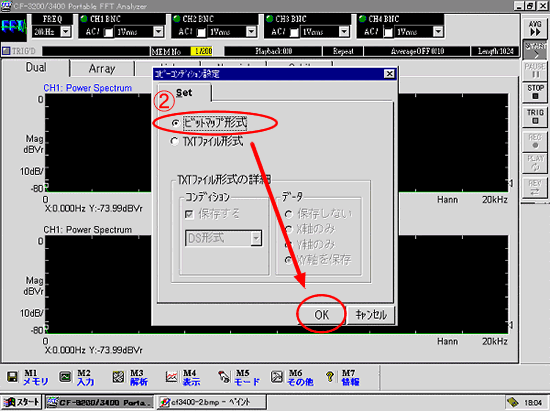
Select 'Bitmap format' and press the OK button.
|
|
-
Click 'Copy' from the menu 'M6 Others'.
-
Launch 'Paint Brush' from a Windows program.
-
Select 'Edit' from the paintbrush menu and paste.
-
Select 'Save As' from the paintbrush menu and save it. Choose the A drive as the destination and save it to the FD.
-
Open Word or Excel on your computer. Left-click at the position where you want to insert the image, then select "Insert" → "Picture" → "From File" from the menu, and specify the bitmap you want to import. (This method results in a smaller file size compared to using the paintbrush tool on the computer to copy and paste.)
■When saving as TXT
-
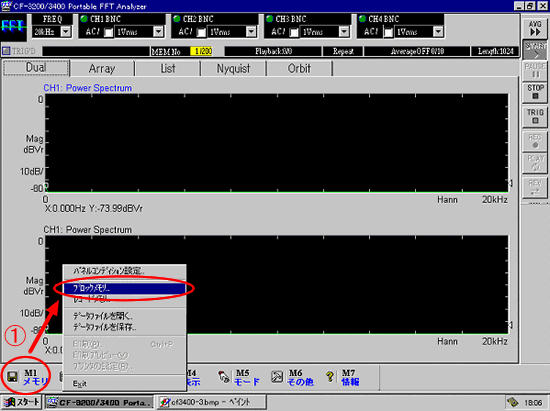
Click on 'Block Memory' from the 'M1 Memory' menu.
|
|
-
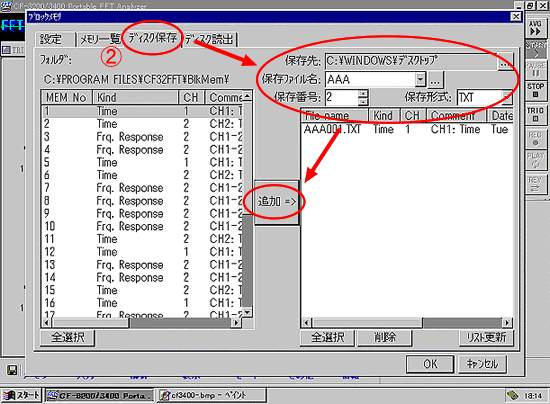
Change the tab button to 'Disk Save', and click to select the block memory data in the data display window on the left.
| save destination | A |
| Save File Name | arbitrary |
| preservation number | arbitrary |
| save format | TXT |
By setting it as described above and clicking the 'Add' button, the data will be saved to FD.
|
|
-
Start Excel on the computer, specify the saved data from the floppy disk, and open it to find data in the cells. This data will be displayed in a graph.
"When saving in 'dat' format and visualizing it using a graph interface"
-
Using the method described in "When saving as TXT," click on "Block Memory" from the "M1 Memory" menu, set the data saving format to "dat." in the "Disk Save" tab, and save it to the FD.
-
Download and install our free software "Graph Interface" from our website. You can access the Graph Interface page here. By pressing the "User Registration" button in the sample program named "Graph Interface" under the item labeled "4. CF/DS Series FFT Analyzer", the download page will open. Additionally, the installation procedure and operation method for this software are explained in the PDF file that appears when you press the "PDF" button.
-
Launch the graph interface, convert the saved data for Excel macros, then open the Excel macro to display the graph.
<Conversion in Graph Interface and Graph Display in EXCEL>
|
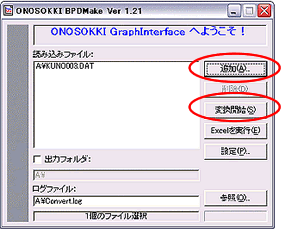
Specify the file to be loaded with the 'Add' button and press the 'Start Conversion' button. |
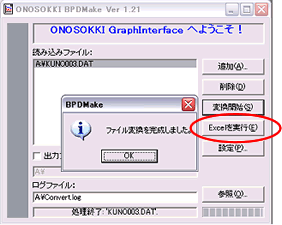
When the conversion is complete, a message like this will appear. Next, press the 'Run EXCEL' button. |
 |
 |
|
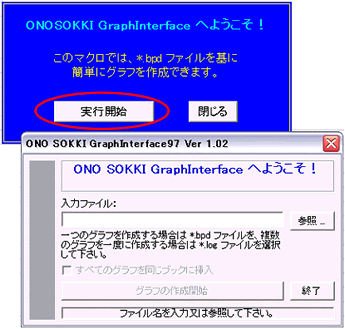
"Welcome to the ONO SOKKI GraphInterface!" When you press the "Start Execution" button, a screen will appear for specifying the input file. Select the file that you have converted beforehand to start creating the graph. |
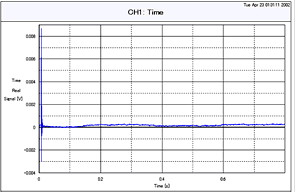
Example of graph display |
 |
 |
Last updated: 2005-02-14