

Frequently Asked Questions about Laser Doppler Vibrometer
Question number FAQ-1350
Measurement and Display Methods of Frequency Response Functions in Vibration Testing
To extract dynamic characteristics from an object as information, it is necessary to observe the state of the system of the object in terms of frequency. The input used for vibration is often 'excitation force', while the responses typically include 'displacement', 'velocity', and 'acceleration', with 'sound', 'strain', and 'stress' also being used. The transfer function at this time is referred to as the Frequency Response Function. The three most commonly used indicators are the following three and mechanical impedance, with mobility being the standard for the frequency response function according to international standards (ISO 7626).
| Displacement / Force | Compliance |
|---|---|
| Speed / Force | Mobility |
| Acceleration / Force | Accelerance ※ |
| Force / Displacement | Dynamic stiffness (N/m) |
| force/speed | Mechanical Impedance (Ns/m) |
| Force / Acceleration | Dynamic mass (Ns 2 /m) |
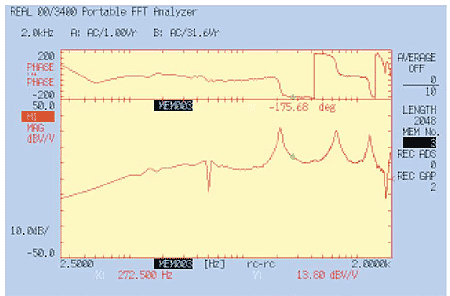
Bode plot
A Bode plot has frequency on a common horizontal axis and displays amplitude and phase vertically. Bode plots are widely used because they make it easy to confirm the location of resonance peaks and the magnitude of frequencies, allowing for a clear distinction between amplitude and phase.
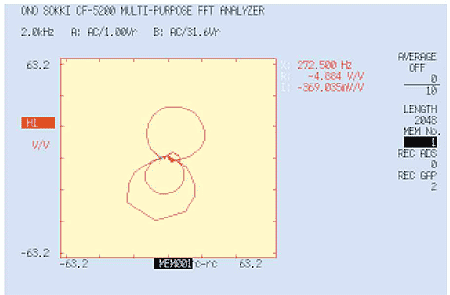
Nyquist plot
This is a method of illustrating the relationship between the real part and the imaginary part on the complex plane, with the real part on the horizontal axis and the imaginary part on the vertical axis. A characteristic feature is that only important resonance points are magnified in the illustration. On the other hand, since frequency does not appear in the graph, it is often displayed along the curve. The CF-5200 series is capable of searching this complex plane and displaying frequencies. Additionally, it allows for a three-dimensional representation with the frequency axis as the Z-axis.
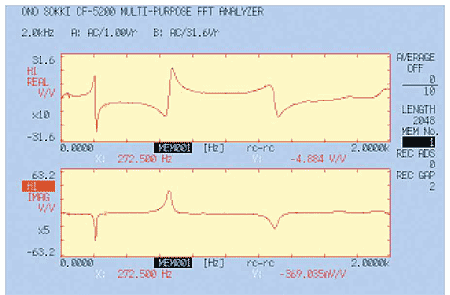
■co.quad plot
This is a method of arranging two graphs vertically, with frequency on the horizontal axis and the real and imaginary parts on the vertical axis. This chart clearly shows phase changes near resonance points and makes it easy to identify resonance peaks, which appear as steep peaks in the imaginary part compared to the Bode plot. However, it cannot use logarithmic scales on the vertical axis, making it difficult to display accurate results in cases of light damping. For reasons such as the lack of direct representation of vibration magnitude and phase, it is not commonly used.
It is also called the Re-Im diagram.
Last updated: 2004-04-19