

DR-7100 Frequently Asked Questions
Question number FAQ-1123
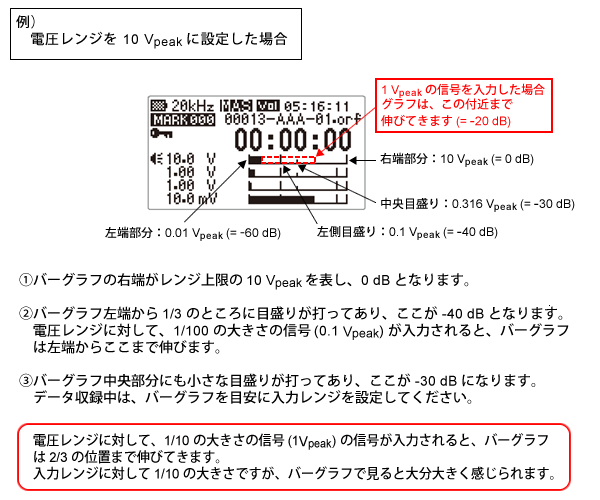
The bar graph display is too large compared to the input signal size. The accelerometer was set to the vibration calibration device, and the sensor output was input into the DR-7100. Based on the sensitivity value, the signal should be about 1/10 of the input voltage range, but the bar graph extends beyond half. Could the output from the sensor be abnormal?
The bar graph of the DR-7100 is displayed in decibel units, showing values from the maximum down to -60 dB. A signal that is 1/10 of the input range has a magnitude of -20 dB relative to the maximum value, so the bar graph extends to about two-thirds of the display area. Therefore, the current display can be considered normal.
Last updated: 2014-04-16