

XN-8000 Frequently Asked Questions
Question number FAQ-1096
How to measure the power spectrum when overalls are at their maximum (MAX OA function)
There is a 'max OA' function in FFT analysis. The procedure is as follows. Please refer to the 'vibration analysis procedure' for how to create operation 1.
Operation
- The analysis system for the config board will be constructed as shown in Figure 1.
- Insert the power spectrum graph into the measurement paper.
Figure 2 below shows an example of four graphs: instantaneous time waveform, instantaneous power spectrum, MAX-OA power spectrum (x-axis Log scale), and the 1/3 octave bundled display of the MAX-OA power spectrum.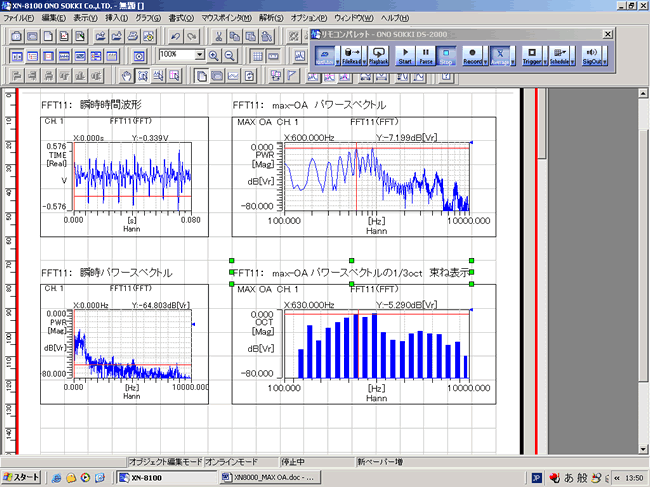
Figure 2- Insert three graphs on the measurement paper: an instantaneous time waveform and an instantaneous power spectrum. Perform a preliminary measurement with the display of instantaneous values and set the scales of the X and Y axes for better visibility.
- Set one of the three power spectra to the MAX-OA of the power spectrum.
●[Display Data] Page Waveform Type MAX OA Figure 3 ●[Axis] Paper X-axis Log Figure 4
Please note that the data for MAX OA will be displayed after the 'averaging measurement' is executed.
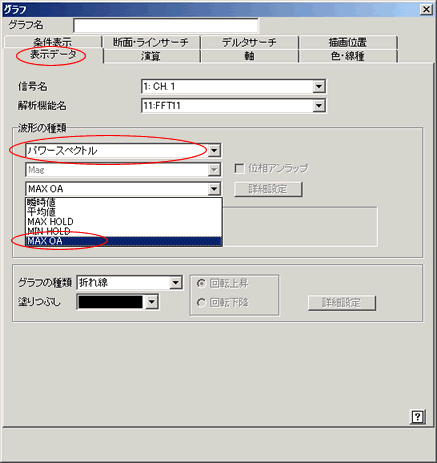
Figure 3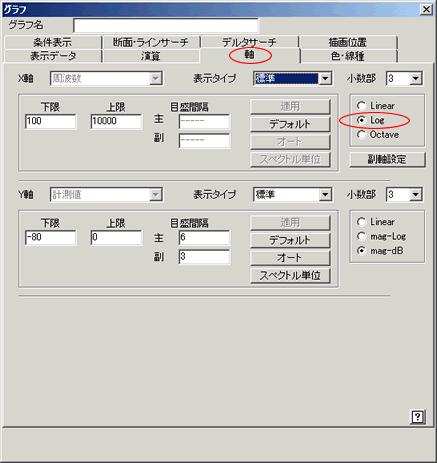
Figure 4- Set one of the power spectra to MAX-OA at 1/3 octave (Figure 5).
Types of waveforms Bundled octave
1/3 octave
MAX OATypes of graphs half bar graph Please note that the 1/3 octave band data will be displayed after performing the averaging measurement.
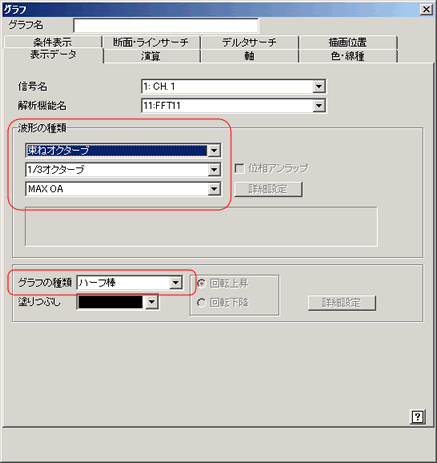
Figure 5 - Averaging measurement
- Click the 【Average▽】 button to open the〔Averaging〕dialog (Figure 6).
Set it as follows and click the OK button to confirm.
Averaging Mode Power SP / Cumulative Average Average time Check
10s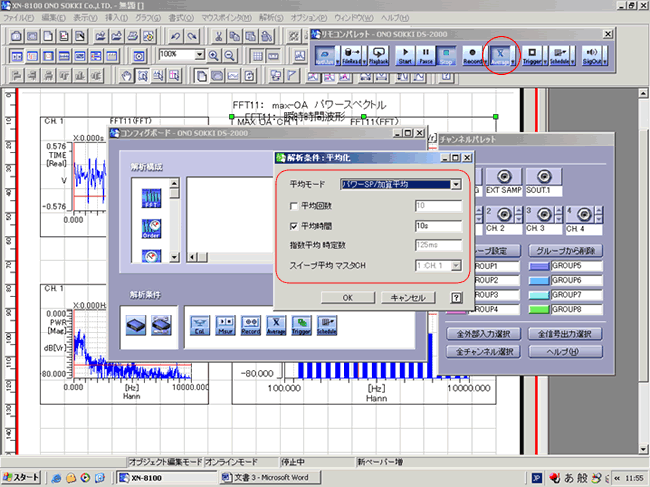
Figure 6- Click the [Average] button to turn it on.
- Click the 【Start】 button to begin measurement.
After 10 seconds, the 【Stop】 button will automatically turn on, stopping the measurement. The measurement results will appear as shown in Figure 2 above. The "MAX-OA Power Spectrum" in Figure 2 displays the power spectrum when the overall was at its maximum during the 10-second measurement period. The "MAX-OA 1/3oct bundled display" shows the MAX-OA power spectrum bundled into 1/3oct. Please note that when bundling into 1/3oct, the lower bands are cut according to the frequency range to ensure accuracy.
- Click the 【Average▽】 button to open the〔Averaging〕dialog (Figure 6).
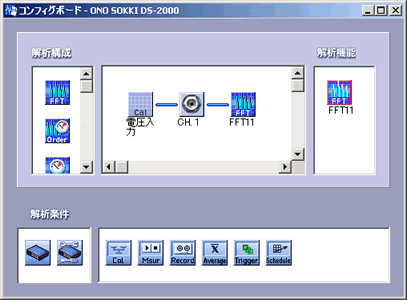
Figure 1
| You can download the project created this time (Sample: 2.7MB) from here. |
Last updated date: 2006-10-23