

XN-8000 Frequently Asked Questions
Question number FAQ-1094
How to measure the peak hold of a power spectrum?
From the screen displaying the power spectrum, perform the following operation.
- Click the ▽ button next to Average on the remote control palette to open the [Average] dialog (Figure 1).
- Select the "Averaging Mode: Power SP / Additive Average" in the averaging dialog (Figure 2).
- Check the "Average Count: (Optional Setting)" in the averaging dialog and set the count (see Figure 2). You can also set it based on average time instead of average count.
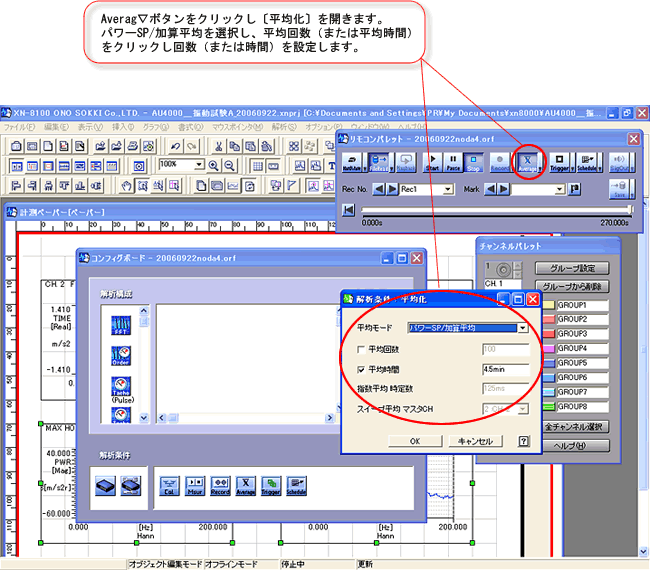
Figure 1 - Drag with the mouse to select the power spectrum graph object, and it will change the border color to green when selected.
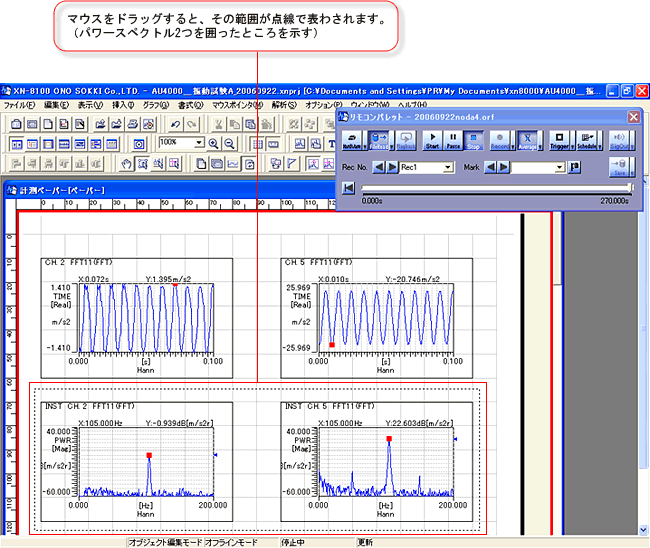
Figure 2 - Double-click the selected graph to open the graph properties (Figure 3).
- Select the waveform type property: power spectrum, MAX HOLD (Figure 3).
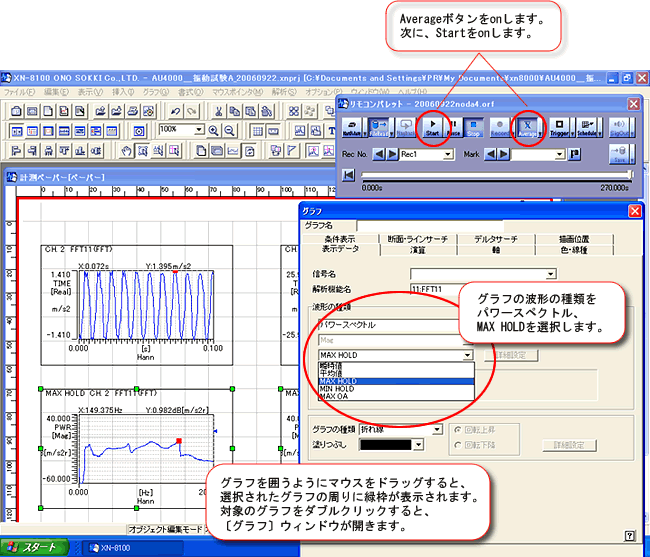
Figure 3
Last updated date: 2006-10-23