

XN-8000 Frequently Asked Questions
Question number FAQ-1091
To save the graph data as a text file.
■ Operating Procedures
- Move the mouse over the graph, click the left button, and select 'Export'. (See Figure 1)
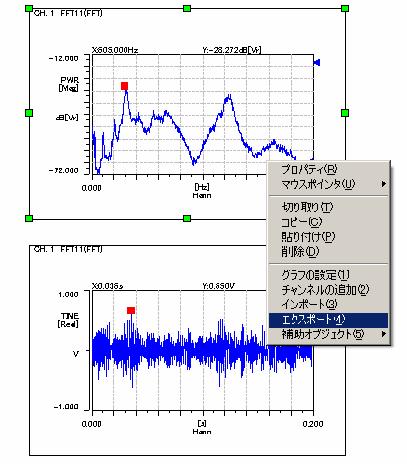
Figure 1 - A save dialog will open, so select the file type 'XN Style CsvFile (*.csv)'. (See Figure 2 below)
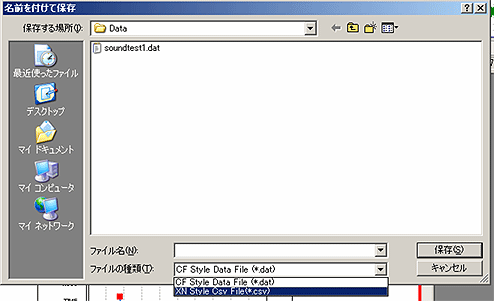
Figure 2 - Enter the file name and click the save button. The export will consist of one graph at a time. The file name will be "****.csv". It can be opened directly in Excel. (See Figure 3 below)
Save content
Label:, DateTime:, 2006/07/25 Preservation Day DataKind:, CH1, PowerSpec, Mag types of data DataPoints:, 802 the number of data DataCalc: types of operations Frequency:, 0.000 , 4000.000, Hz Frequency Range Sample:, 2048, Internal Number of time data samples Average:, 92, Average number of processing times Voltage(CH1):, 20.000, dBVrms Input Voltage Range EU/V(CH1):, 1.000E+00 calibration value Window(CH1):, Hann time window X-AxisScale:, Lin X-axis: Linear or Logarithmic X-AxisUnit:, Hz X-axis unit name Y-AxisScale:, Log Y-axis: Linear or Log (dB)? Y-AxisUnit:, V Y-axis unit name Y-AxisMagniude:, rms Y-axis spectrum unit 0.00000000e+00, -5.76177444e+01 X-axis value and Y-axis value 5.00000000e+00, -4.92056198e+01 1.00000000e+01, -4.20467758e+01 1.50000000e+01, -4.46867065e+01 2.00000000e+01, -5.30282211e+01 2.50000000e+01, -5.28174934e+01 3.00000000e+01, -5.18382607e+01 3.50000000e+01, -5.57555237e+01 4.00000000e+01, -6.08964043e+01 ・
・
・(omitted) 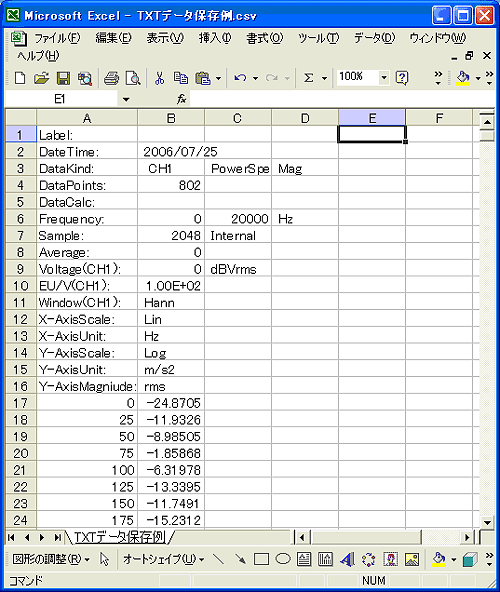
Figure 3 Example of Power Spectrum Opened in Microsoft Excel
Last updated: August 21, 2006