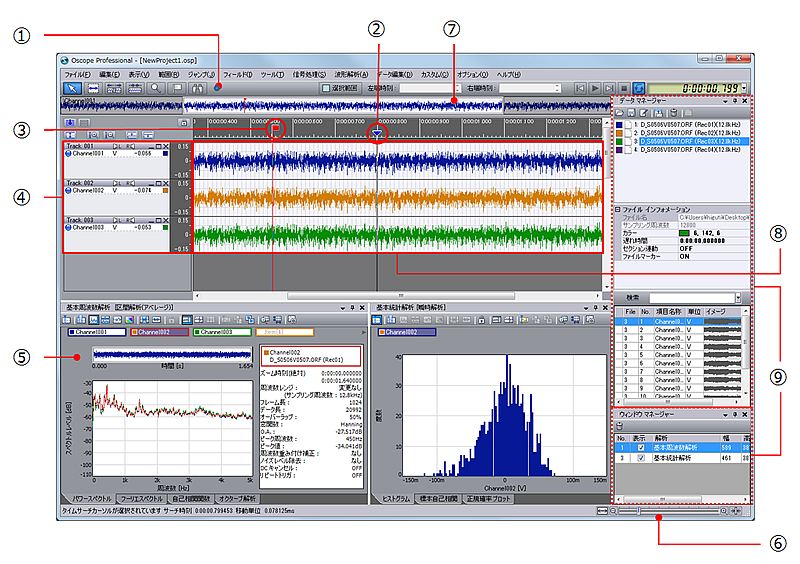
① | toolbar | - This is a bar where various tool buttons, a play button, and a time display are arranged.
|
② | Time Search Cursor | - This is a bar that displays values on items at specified time positions.
It does not move when the screen is scrolled.
|
③ | marker | - Clicking the [Marker] button on the tool toolbar will display it above the search cursor.
Multiple markers can be displayed.
|
④ | Track Display Area | - To register an item, drag it from the data manager to this area.
|
⑤ | Analysis Window | - From statistical analysis to frequency analysis, a variety of analytical functions are available.
Traditionally, analyzing large volumes of data that required extensive data processing and editing took a lot of time, but now it is possible to quickly analyze just by moving the cursor to the points of interest.
|
| ⑥ | Zoom bar | - You can zoom in or out on the waveform display by sliding left or right.
|
| Navigation View | - This is a window that displays the entire waveform. You can grasp the overall trend of the waveform at a glance.
Additionally, it has features for quick navigation to the areas you want to analyze, as well as zooming in or out.
Initially, the waveform of the item placed at the very top of the main field is displayed.
By dragging & dropping the item onto the navigation window, you can
swap the waveform in the navigation window.
|
⑧ | main field | - This is an area that displays waveforms of multiple items simultaneously.
It is also possible to overlay multiple files, such as past data, on the same track.
In the main field, editing processes such as cutting and moving waveforms can be easily achieved just by using the mouse.
|
⑨ | docking window | - The plugin launcher, data manager, database window, marker list, properties window, and analysis window can be docked to the main window.
|