

OC-1300 series Frequently Asked Questions
Question number FAQ-0942
To make contour maps and clipping maps transparent.
 |
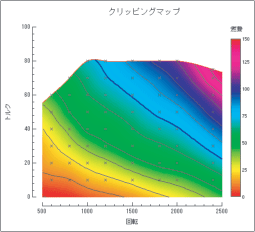
Since the image is placed below the graph, we will turn on the transparency effect to make the image visible. |
 |
|
 |
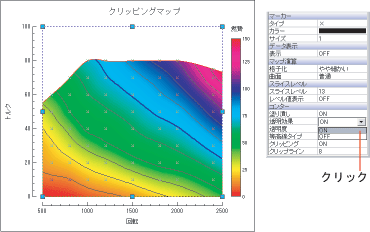
Select the clipping map and open properties from the popup menu. Next, set the [Transparency Effect] of the contour to "ON." |
 |
|
 |
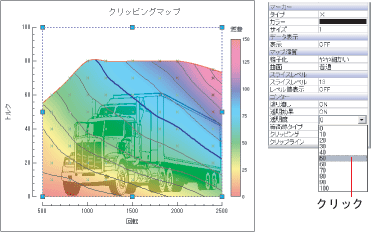
Next, select the [opacity] of the contour. The clipping map becomes semi-transparent, allowing the image below to show through. |
 |
|
Last updated date: 2026-07-15