

Basic FAQ for FFT Analyzer
Question number FAQ-0781
What do the dB values on the vertical axis (Y-axis) of the power spectrum represent?
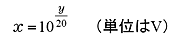
dB (decibel) is defined as ten times the logarithm of the ratio to the reference value of a physical quantity, and is usually a relative value. However, the dB value of the power spectrum is measured in V when the physical quantity does not calibration 2 Therefore, 1 V 2 (RMS squared) as the reference value dBV is displayed as the absolute unit. In other words, the power spectrum of a certain frequency is x2 If so, the dB value is:
 |
(1) |
 |
(2) |
Table 1 shows examples of numerical values for the linear spectrum x (V) and power spectrum y (dBV).
Table 1: Specific numerical examples of power spectrum and linear spectrum.
| Power spectrum (V 2) | Power Spectrum (dBV) | Linear Spectrum (V) |
|---|---|---|
| 0.0001 | -40 | 0.01 |
| 0.01 | -20 | 0.1 |
| 0.5 | -3.01 | 0.707 |
| 10 | 10 | 3.16 |
| 100 | 20 | 10 |
(Note) The power spectrum is the square mean value (RMS), so it is sometimes displayed in a more understandable unit, dBVr.
 |
Last updated: November 16, 2009