

Basic FAQ for FFT Analyzer
Question number FAQ-0775
When using the integration function on acceleration data to determine displacement and conducting tracking analysis, the MAXOrd value is displayed as larger than the O.A. (Overall) value. Why is that?
This is due to the effects of windowing correction. Normally, there are influence components from the window on both sides of any frequency component in the frequency spectrum, but when calculating the overall value, a certain coefficient is applied to correct for this influence. The same correction is applied during frequency calculus, which is why this phenomenon occurs.
<Reference Example>
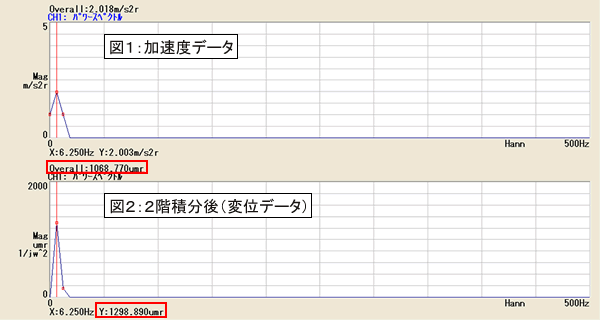
[Figure 1]
If there is an amplitude at 6.25 Hz next to 0 Hz, amplitude values will also appear at 0 Hz and 12.5 Hz due to the effect of the time window.
Additionally, if there is an amplitude at 0 Hz, amplitude values will appear at 12.5 Hz due to the effect of the time window (this occurs due to fluctuations and residual offsets in the circuit).
In the case of the Hanning window, the overall value is calculated by dividing the total power of all frequency data by 1.5 (the coefficient "1.5" here is referred to as the "equivalent noise bandwidth").
[Figure 2]
When performing integration, the integral value at 0 Hz cannot be defined, so the 0 Hz component is forcibly set to "0." At this time, the leakage at 6.25 Hz is also set to 0, so when divided by 1.5, the overall value becomes smaller than the peak value.
In integration, the influence of low-frequency components is significantly pronounced, and frequency components smaller than the resolution of the FFT analyzer become uncertain. For the integration results, we recommend using a partial overall with a specified frequency band (generally above 3 Hz).
Last updated: June 20, 2014