

FFT Analyzer Basic FAQ
Question number FAQ-0749
How is frequency resolution determined?
If the frequency resolution is Δf, then from the formula in the FFT analyzer basic FAQ "What is the relationship between time window length and number of sampling points?", we get:
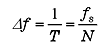 |
(1) |
This is the relationship.
Therefore, to increase the frequency resolution (reduce Δf), the time window length needs to be increased. This can be achieved by either lowering the sampling frequency fs or increasing the number of sampling points N. Normally, the sampling frequency is automatically determined when the analysis frequency range is set, so in practice, the frequency resolution mainly depends on the number of sampling points N.
In an FFT with N sampling points, frequency spectra of N /2 points are obtained, and within the analysis frequency range, frequency spectra of N /2.56 (number of analysis lines L) are obtained. In other words, the relationship between the number of analysis lines L and N is the same as the formula in the FFT analyzer basic FAQ "What is the relationship between frequency range and sampling frequency?";
 |
(2) |
This is the result.
The following points should be noted regarding frequency resolution:
To observe the instantaneous time variation of the spectrum, it is necessary to increase the time resolution (which requires reducing the time window length), and from equation (1), the frequency resolution deteriorates. Therefore, in typical FFT analysis, the time resolution and frequency resolution of the spectrum are inversely related.
When analyzing random signals from limited time signal data to calculate and estimate the Power Spectral Density (PSD), increasing the time window length does not improve statistical accuracy; it only increases the frequency resolution. If only limited time data is available, it is preferable to shorten the time window length, even if it slightly reduces the frequency resolution, and to estimate the PSD by maximizing the number of averages.
To summarize the relationships between the time axis, frequency axis, and number of sampling points so far:
- The analysis frequency range is determined by the sampling frequency, and frange = f s/2.56
- The number of analysis lines is determined by the number of sampling points, L = N / 2.56
- The time window length is determined by the sampling frequency and the number of sampling points, where T = N / f s
- The frequency resolution is determined by the time window length, where Δf = 1/ T
It will be.
 |
(Note) For specific numerical examples for each frequency range, please refer to Tables 1, 2, and 3 on the above page. |
Last updated: 2009-11-16