

DS-3000 Frequently Asked Questions
Question number FAQ-0742
How can I simultaneously view the tracking diagram and either the power spectrum or the time waveform during tracking measurement?
Description of setting items
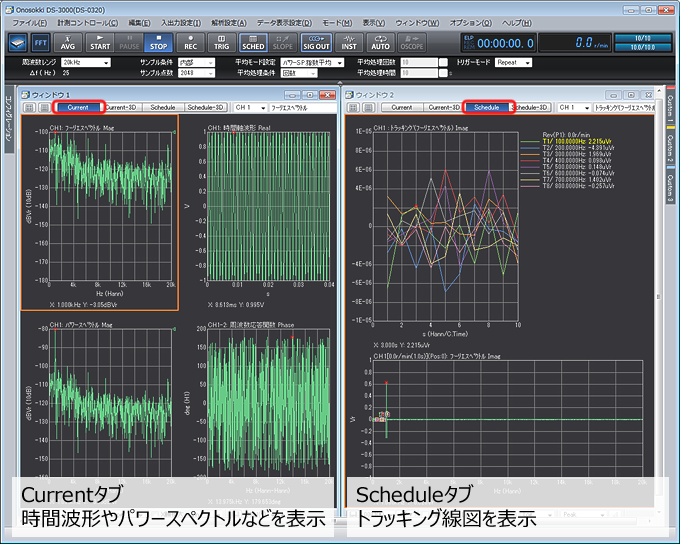
Current tab: A screen that displays instantaneous data and average data such as power spectrum and time waveform.
Schedule tab: A screen that displays the tracking diagram (horizontal axis rotation speed or time).
Procedure
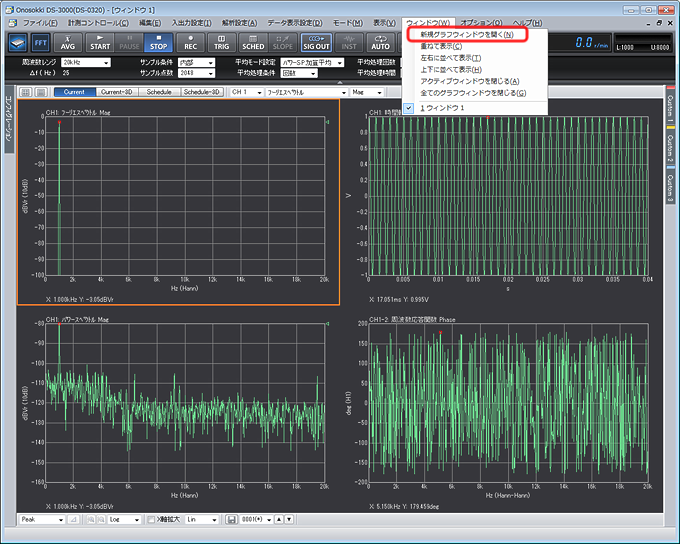
In the initial state, only one graph window is displayed on the screen. For example, when you want to compare the graphs from the Current tab and the Schedule tab, it is recommended to display multiple graph windows instead of frequently switching between tabs. From the menu at the top of the screen, select [Window (W)] > [Open New Graph Window (N)] to display multiple graph windows as needed.
From the menu at the top of the screen, select [Window (W)] > [Arrange Side by Side (T)] to display multiple graph windows. By setting Window 1 to the Current tab and Window 2 to the Schedule tab, you can display them simultaneously and compare.
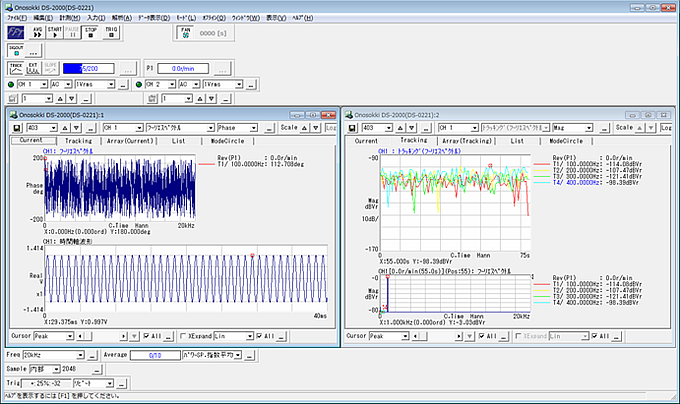
* DS-0222A can also be displayed using the same procedure.
Last updated: 2016-03-31