

DS-2000 Frequently Asked Questions
Question number FAQ-0715
Display the average noise level measured at four points around the object, calculating the average power spectrum.
Using a mathematical expression, we will display the calculations. The average power spectrum when measuring the noise of an object simultaneously at four positions (up, down, left, right) can be calculated using the following mathematical expression.
 |
PWR1, PWR2, PWR3, and PER4 refer to the power spectra of channels ch1, ch2, ch3, and ch4.
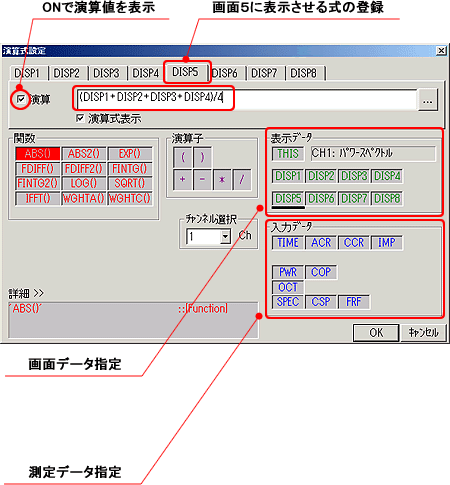
For power spectra saved in a file, the data is called up on the screen before performing calculations. The calculation formula can be entered by clicking on the registered name of the screen data from the input data section of the formula settings screen, or by typing it in using the keyboard. The screen data corresponds to DISP1 to DISP4 from the upper left and DISP5 to DISP8 from the lower left in an 8-screen display. The calculation formula is specified at the screen data display position.
This example shows how to call saved data from screen 1 to screen 4 and display the calculation results on screen 5.

Measurement Example
Set to 8-screen display on the 'Data Display → Layout Settings' page.
Display the power spectra saved in screens 1 to 4 on the 'File → Open Data' page.
Click on the frame of screen 5 to make it active (the data text will change to blue).
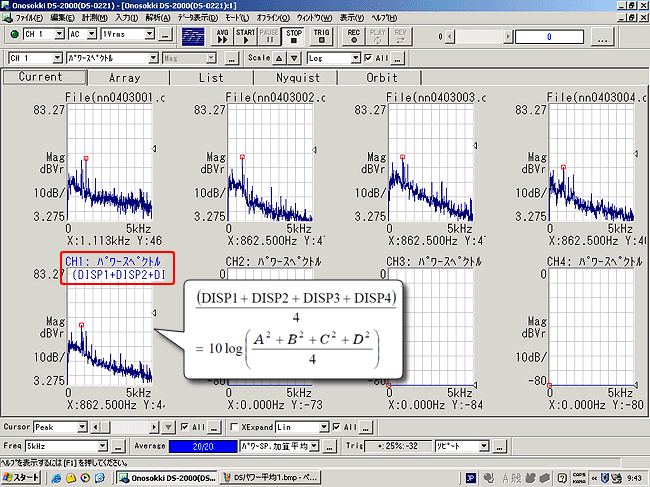
Open the "Analysis → Calculation Formula Settings" page, create the following calculation formula in DISP5, check the box for "Calculation", and click the OK button. The calculation will be executed and the results will be displayed on screen 5.


 A ~ D: Power Spectrum of Screen 1 to Screen 4
Calculation Expression Setting Screen
Display of calculation results
Memo
Power spectrum data stores the square value of amplitude A (RMS), and based on this value, when the Y-axis scale is log, it displays 10logA 2, and when it is LIN, it shows √A2.
The above calculation performs the following computation.
●When the Y-axis is on a linear scale
A ~ D: Power spectrum of the same frequency.
● When the Y-axis is on a log scale (dB)



Last updated: April 16, 2007