

DS-2000 Frequently Asked Questions
Question number FAQ-0686
A method for calculating acoustic power levels simply using data from the DS-0225 three-dimensional sound intensity software.
This document explains a simplified method for calculating sound power levels using data from the DS-0225 three-dimensional acoustic intensity system. It assumes that trace data for a surface with a sound source has already been created using the DS-0225 acoustic intensity analysis software. Normally, calculations are performed over the entire surface surrounding the sound source, but this explanation focuses on calculating the sound power level for a single surface. The measurement procedure for the DS-0225 is omitted. The method described here does not comply with ISO or JIS standards due to the reasons that "1. the frequency range is narrow" and "2. the microphones are not arranged in a face-to-face configuration." For measurements compliant with ISO and JIS standards, please refer to the following catalogs.
DS-0234 Acoustic Power Measurement (SI Method) System
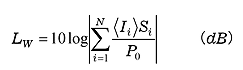
■ Calculation Formula for Acoustic Power Level
Enclose the sound source with a closed surface and set a virtual surface that will serve as the measurement surface. The acoustic power level (L W) can be calculated from the measured acoustic intensity data (I i) of DS-0225, which is obtained by further dividing one of the surfaces and measuring at each point. In DS-0225, since the frequency band is set when creating trace data, the calculated acoustic power will be the acoustic power for that frequency band.
Here,
| <ii> </i | Vertical component of acoustic intensity for the i-th surface element on the measurement surface. |
| Si | the area of the surface element of the i-th face |
| N | Number of surface elements |
| P0 | : Reference acoustic power (= 10-12 W) |
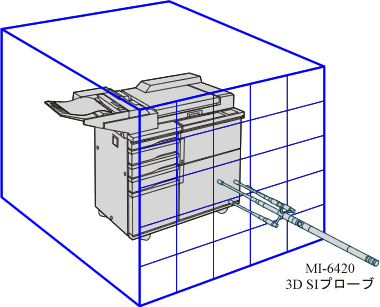
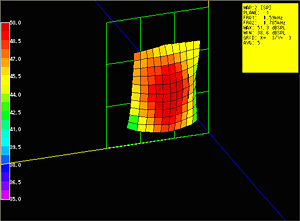
The figure below is an illustration of a one-sided measurement.
 |
 |
■ Operating Procedures
Import trace data into EXCEL.
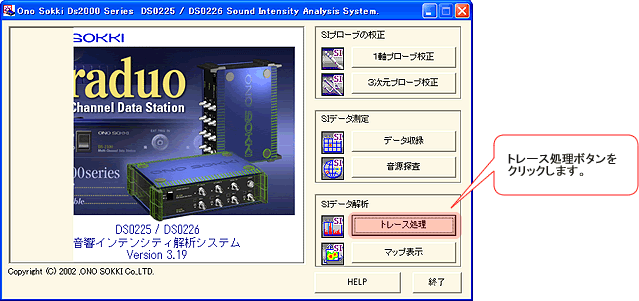
After recording the data, click the 'Trace Processing' button to open the trace processing screen.
In the 1-2 trace screen, when you set the upper and lower limit frequencies and execute the trace, a TXT file of the trace
data is automatically created.
The figure below shows the execution of the trace in Trace 5.
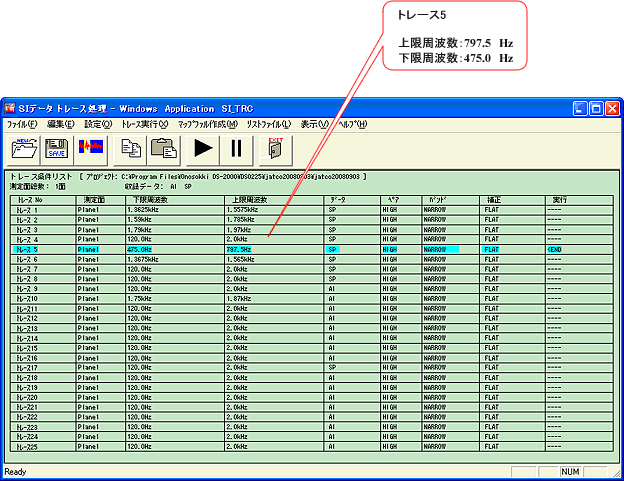
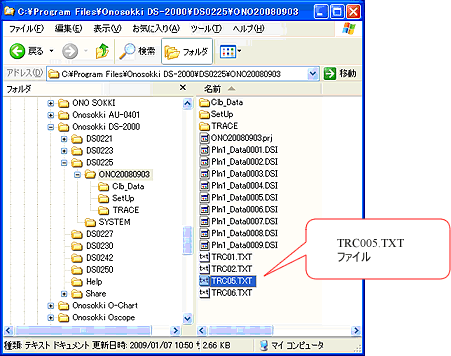
Figure 1-3 shows the appearance of the trace data TXT file "TRC05.TXT" being created in the folder of the project name at the time of data recording.
Open the file in Microsoft EXCEL.
The image below shows how to open "TRC05.TXT".
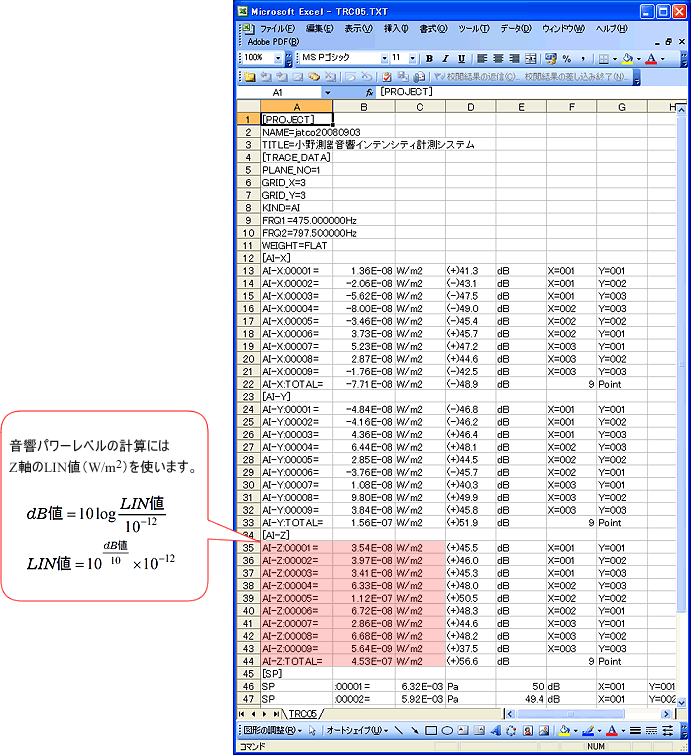
Import trace data into EXCEL.
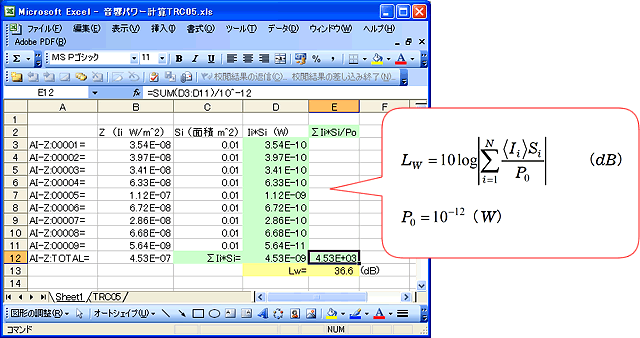
The figure below shows the process of extracting and calculating the Z-axis of the trace data imported into EXCEL. The I i in the calculation formula uses the intensity LIN value of the Z-axis (W/m 2). Assuming the area per measurement point is S i = 0.1 m × 0.1 m = 0.01 m 2, the acoustic power level in a certain frequency band (in this example, 475 Hz to 797.5 Hz: see (1-2)) can be calculated as L W =36.6 dB. The TXT data contains the value of Σ I i as "AI - Z :TOTAL = ", but this will be excluded from the calculation. The value of "Σ I i * S i" will be the same as "(the value of AI - Z : TOTAL) × S i" if S i is the same for all.
Note on calculations
- If the value of I i is negative, calculate "I i * S i",
"Σ I i * S i" while keeping the negative value.
- "I i * S i", "ΣI i * S i" are the acoustic power levels (W: power) of that area, which are meaningful values. Therefore, "Σ I i * S i /P o" is calculated at the end.
- If the values of "I i * S i" and "ΣI i * S i /P o" are negative values, it indicates that the sound source is located elsewhere, and a review of the measurements is necessary. Additionally, remaining negative will result in an error in logarithmic calculations.
Last updated: March 16, 2009