

DS-2000 Frequently Asked Questions
Question number FAQ-0679
How to display time waveforms and power spectrum waveforms at a specific rotational speed using data processed by the DS-0222 tracking analysis software?
Operation Procedure
- Click on 'Preview' after selecting 'Offline' to open 'FileView'. On the preview side, specify the analysis range to include a specific rotation speed in advance (determine the start of the analysis for the ORF file).
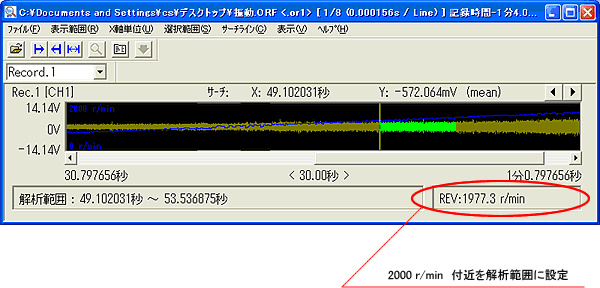
- Set the DS-0222 tracking software as follows.
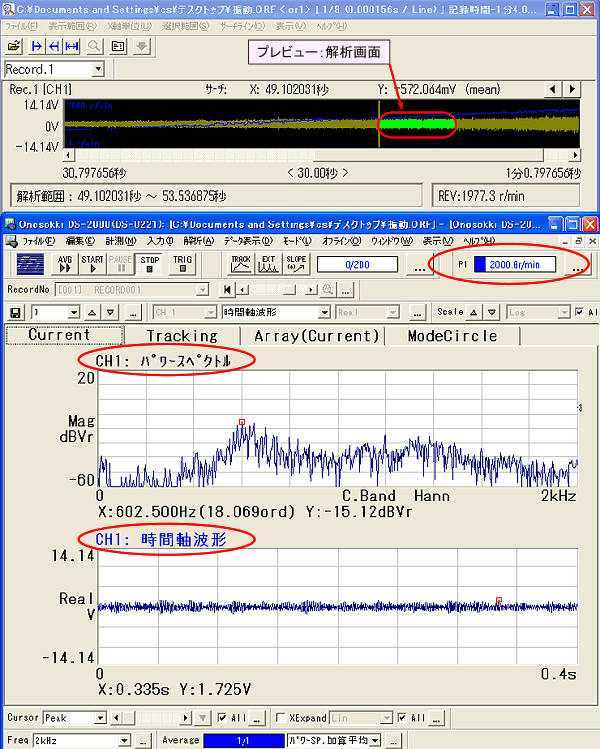
Average processing settings Averaging Mode Power Spectrum Addition Average average method number of times average number 1 time Sample condition setting Sample score 2048 points, or an appropriate score. overlap amount 50 % - Clicking the AVG button will display the first 2048 data points specified in the analysis range in step 1. (Check the rotation speed monitor)
- By continuing to click the AVG button, since the overlap amount is 50%, it will update and display data for 1024 points. (Check the rotation speed monitor)
I will repeat: the data is 50% overlapped, so there are no omissions.
Last updated: August 21, 2006