

DS-2000 Frequently Asked Questions
Question number FAQ-0677
What are the differences in display settings due to 'Peak Search' and 'Order Band' settings in the DS-0222 tracking analysis software?
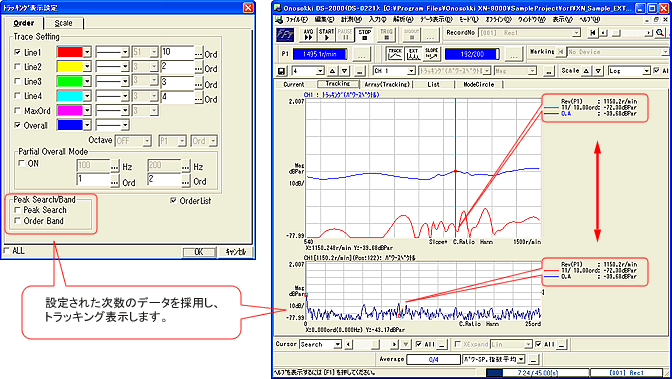
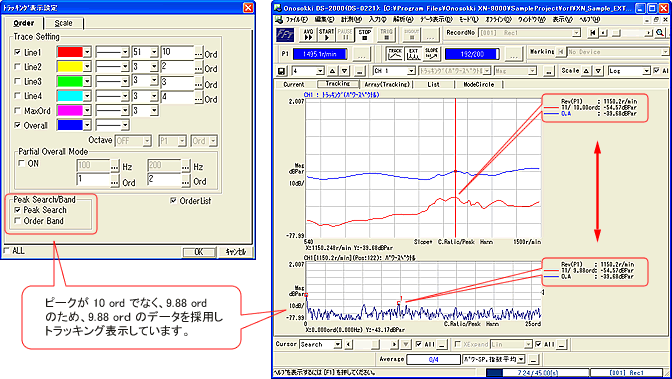
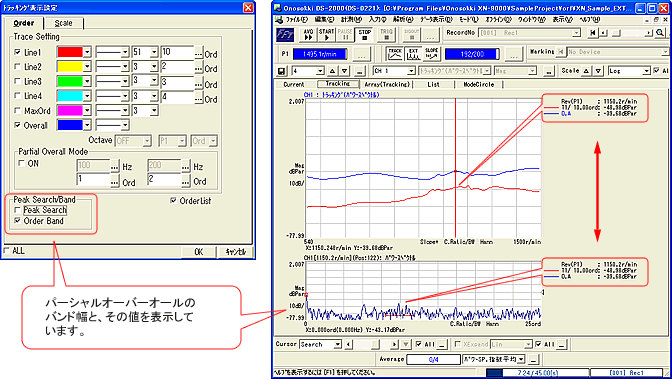
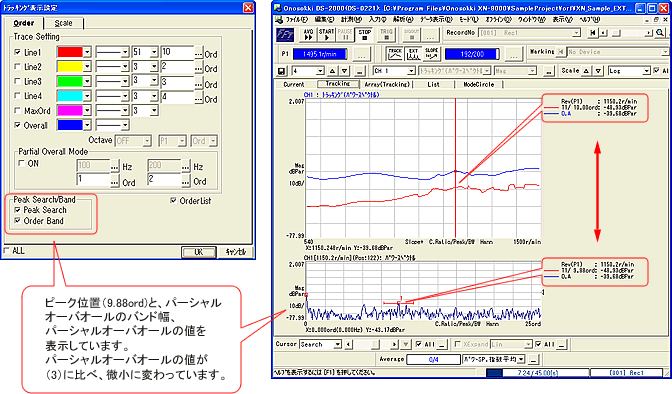
Due to differences in settings, tracking data will be displayed as shown in the following table. This is explained with an example where the bandwidth setting is set to '51'. Additionally, a display example at that time is shown in the figure below.
| Peak Search | Order Band | drawing data | display on the graph |
|---|---|---|---|
| OFF | OFF | It will be displayed at the set number of times at one point. | The peak point is displayed with □. |
| ON | OFF | We search for peaks in the data centered around the specified number of points, within a width of 51 points, and display this data. The peak points may change with each rotation. | The searched peak point is displayed in □. |
| OFF | ON | We will calculate a partial overall with a width of 51 points centered around the set number of points and display this data. | The bandwidth is displayed with a red line. |
| ON | ON | Search for peak data within a width of 51 points centered around the specified point, calculate the partial overall based on this peak point, and display this value. The peak point may change with each rotation. | The searched peak point is indicated by a box (□), and the bandwidth is displayed with a red line. |
■ Peak Search: OFF and Order Band: OFF
<Tracking with the data of the set number of times>
■ Peak Search: ON and Order Band: OFF
<Tracking display with peak data within the band width>
■ Peak Search: OFF and Order Band: ON
<Calculate the partial overall of the band width centered around the set number of times, and display this tracking>
■ Peak Search: ON and Order Band: ON
<Calculate the partial overall centered on the peak points among the set order points, and display this tracking>
Last updated: November 17, 2008