

CF-5200 Frequently Asked Questions
Question number FAQ-0367
When the acceleration signal is double integrated over the time axis, it becomes a parabola. Why?
When the acceleration signal is a minute voltage signal, double integration will result in a relatively large DC component and extremely low frequency components compared to the signal. Therefore, depending on the input signal, the double integrated data may become parabolic or exhibit an upward or downward trend.
Thus, it is necessary to amplify the voltage signal when capturing it with the FFT analyzer to reduce the DC component and extremely low frequency components.
The practical method is to convert the displacement signal into a sufficiently large voltage through an analog integrator and input it into the FFT analyzer.
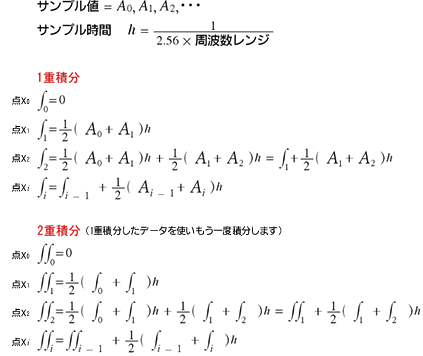
The formula for integration is
 |
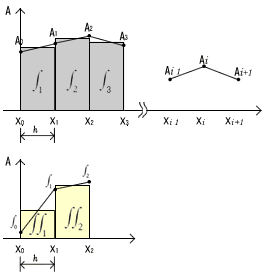 |
will become.
In double integrals, the calculation involves h squared, and since h is a small value, the result of the double integral will be a very small value.
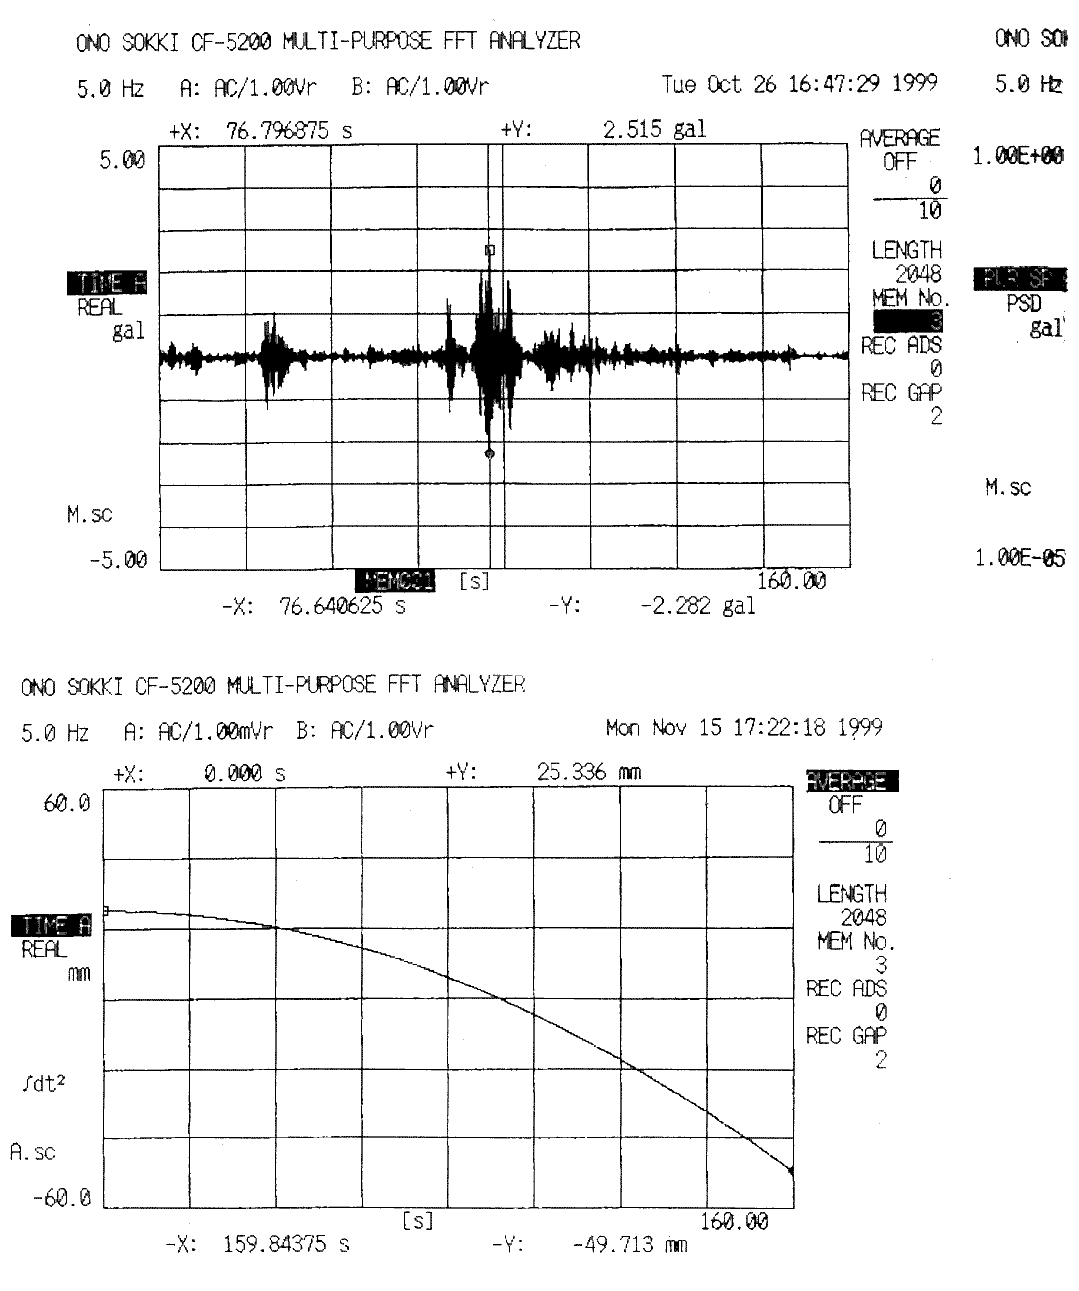
The data in the figure shows the upper part as the acceleration waveform and the lower part as the waveform after double integration. The parabolic shape from the double integration corresponds to the addition of a DC component (offset), and there is a slight AC component (variation) present within it.
Auto-scaling is affected by DC components and does not scale properly for AC components. To observe the AC components, one would need to zoom in using manual scaling, but it is difficult to obtain the expected displacement waveform from the acceleration waveform, resulting in a rather challenging situation.
(It does not have the function to remove low-frequency and DC components after integration.)
Last updated: June 20, 2005