

DS-2000 Frequently Asked Questions
Question number FAQ-0163
The relationship between data length, frequency resolution, and the display length of the TIME waveform is
I have created a table showing the relationship between data length (number of sampling points), frequency range, frequency resolution, and the display length of the time waveform.
| data length | Table 1 16384, 8192, 4096 points |
Table 2 2048, 1024 points |
Table 3 512, 256, 128 points |
|---|
In the CF series and DS series, the FFT treats the number of sampling points as a group of data in powers of two. Therefore, a fixed number of points is displayed on the FFT analyzer's screen. For time-domain waveforms, for example, it displays data with a sampling point count of 2048.
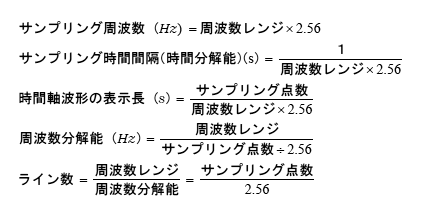
In the case of power spectrum display, data points are shown from 0 Hz to the frequency range with a number of "lines". In the FFT analyzer, settings for the "frequency range" and "number of sampling points" are made, which determines the "frequency resolution" from the frequency range and the number of sampling points, and the number of lines, which is the inverse of the frequency resolution, is established. In the power spectrum, the power spectrum for each step of frequency resolution is displayed as a number of lines. This relationship is shown in the following equation.
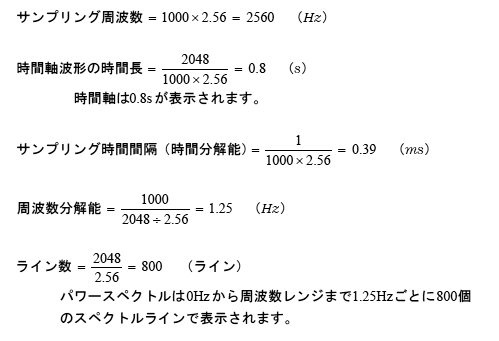
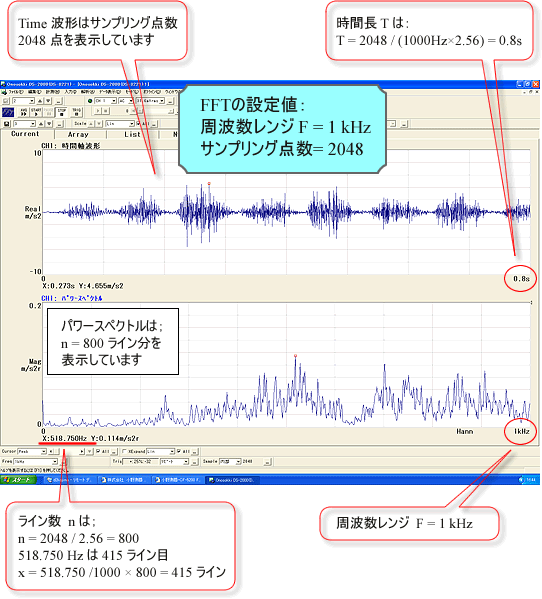
(Example) Frequency range: 1kHz (1000Hz), number of sampling points: 2048.
Last updated: 2002-06-17