

DS-2000 Frequently Asked Questions
Question number FAQ-0673
The function of the Wigner wavelet.
The DS-0230 time-frequency analysis software is designed to perform computational processing on time-axis data (file extensions: .dat/.prn) recorded by each software in the DS-2000 series and our FFT analyzers (such as the CF-6400/CF-5000/CF-4200 series), executing operations like short-time Fourier transform, wavelet transform, and Wigner distribution analysis.
item | Wigner distribution | wavelet transform | STFT |
|---|---|---|---|
| temporal resolution | high | High frequency : High Low frequency : Low | certainly |
| frequency resolution | high | High frequency : Low Low frequency : High | certainly |
| Features | The resolution is high to the physical limit allowed. | The balance between time and frequency resolution is good. | With the extension of FFT, stable results can be obtained. |
| problem | The presence of cross items negative energy | I only know the approximate frequency. | Both time resolution and frequency resolution are not very high. |
| example of use | Abnormal Vibration Analysis of Copier Drum | audio analysis, image communication field | Normal time, frequency analysis |
Wigner distribution
The Wigner distribution is an analytical method that allows for the simultaneous analysis of temporal variations and spatial transitions of complex waveforms such as sudden or non-stationary sounds and vibrations. Proposed by E. Wigner in 1932 in the field of quantum mechanics, it gained attention as a means of analyzing non-stationary signals after being applied to acoustic analysis by T. Classen and W. Mecklenbraker. The Wigner distribution, which has dimensions of energy, offers the highest resolution in both time and frequency, enabling it to capture the characteristics of transient signals better than traditional methods. However, it often presents negative energy and cross terms, necessitating specialized interpretation. By utilizing the time-frequency distribution of non-stationary signals provided by the Wigner distribution function, it is expected to become an effective tool for analyzing shock sounds, abnormal noises, and the transient characteristics of acoustic devices.
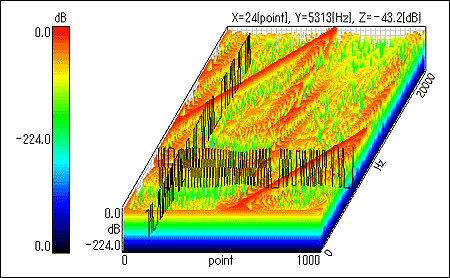
| time axis resolution | 200 points |
|---|---|
| frequency resolution | 256 points (showing 200 points) |
| Length of the rug window | Odd points from 1 to 257 can be set arbitrarily. |
| Analysis Time Frame Length | Maximum 16384 points |
| 3D display | 3D representation using amplitude (dB) with colors (64 colors) |
| Data Reading | by search point |
| Cross-section diagram display | Display of cross-sectional diagrams using a search cursor. |
Wavelet transform
Wavelet transform is a new analytical method that allows for the simultaneous analysis of temporal variations and spatial transitions in complex waveforms such as sudden or non-stationary sounds and vibrations. Initially introduced by petroleum exploration engineers as a tool for analyzing artificial seismic waves, wavelet transform has been developed through the efforts of physicists, mathematicians, and engineers, who have attempted to apply it across various fields based on its mathematical foundations. As the name 'wavelet' (localized small wave) suggests, it uses a single function that is localized both temporally and frequency-wise (in practical terms), applying scale and shift transformations to obtain a set of functions used as basis functions. This natural analytical method employs long time data for low frequencies (slow variations) and short time data for high frequencies (rapid variations), making it a notable tool for analyzing various transient phenomena. The distribution of the absolute square values of the wavelet transform results is referred to as a scalogram. The DS-0230 time-frequency analysis software can display the signal's spectrum on a time-frequency plane as a two-dimensional or three-dimensional color image.
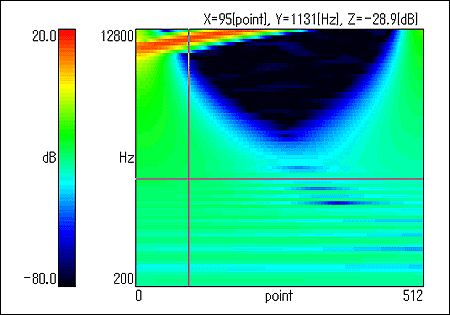
| Mother Wavelet | Gabor function |
|---|---|
| time axis resolution | 200 points |
| frequency resolution | 256 points (showing 200 points) |
| Length of the rug window | Odd points from 1 to 257 can be set arbitrarily. |
| Analysis Time Frame Length | Maximum 16384 points |
| 3D display | 3D display using colors (64 colors) based on amplitude (dB) |
| Data Reading | by search point |
| Cross-section diagram display | Display of cross-sectional diagrams using a search cursor. |
STFT
The Short Time Fourier Transform (STFT) is a method that captures the time variation of frequency components in non-stationary signals by segmenting the signal into short time intervals and applying Fourier transform to each segment. The short-time Fourier transform is the simplest and most manageable method for analyzing non-stationary signals. Generally, in FFT, to improve the accuracy of time variation (time resolution), it is necessary to shorten the time length of the segments, which in turn worsens the accuracy regarding frequency (frequency resolution). Therefore, in STFT, by separately setting the length of the time window and the Fourier transform, a method has been devised to improve time resolution while maintaining the necessary frequency resolution. The distribution of the absolute squared values of the short-time Fourier transform results is called a spectrogram.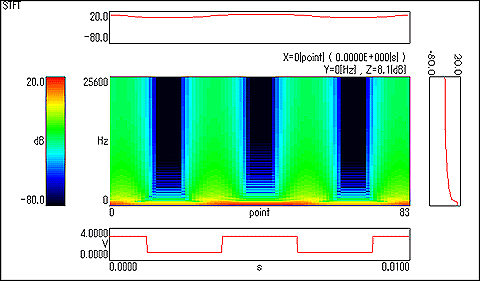
| time axis resolution | Maximum 8192 points |
|---|---|
| frequency resolution | Maximum 2048 points |
| Analysis Time Frame Length | Maximum 16384 points |
| FFT frame length | Maximum 4096 points |
| 3D display | 3D display using colors (64 colors) based on amplitude (dB) |
| Data Reading | by search point |
| Cross-section diagram display | Display of cross-sectional diagrams using a search cursor. |
Last updated: July 11, 2003