本文にスキップする

Select your region & language

Global

Region

Multi-stage injection quantity measurement system
FJ-8000シリーズ
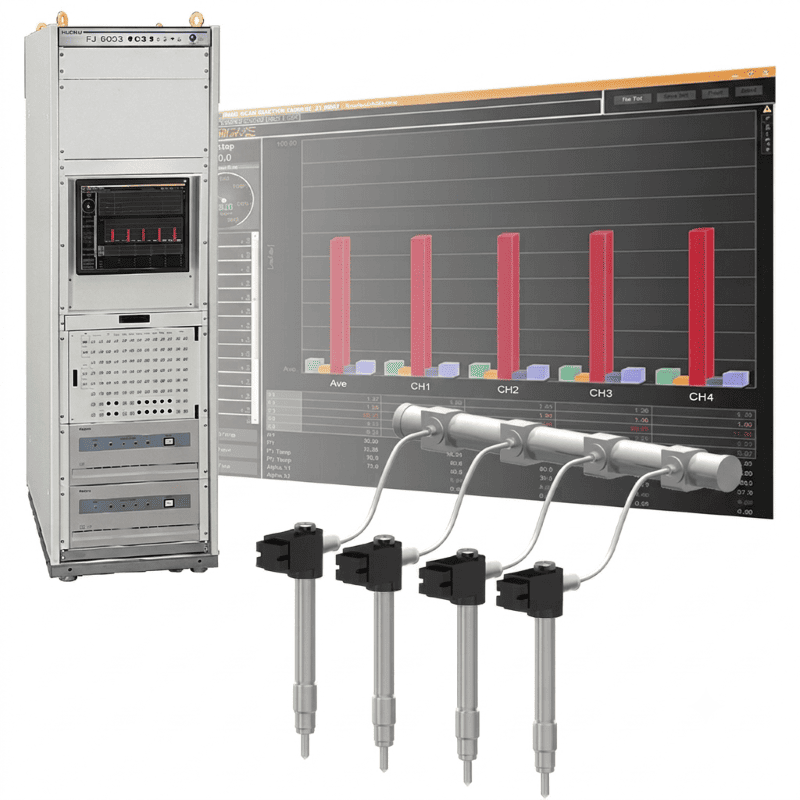
By visualizing the injection state of the common rail, we achieve engine development that reduces NOx and PM emissions, improves fuel efficiency, and lowers vibration and noise.

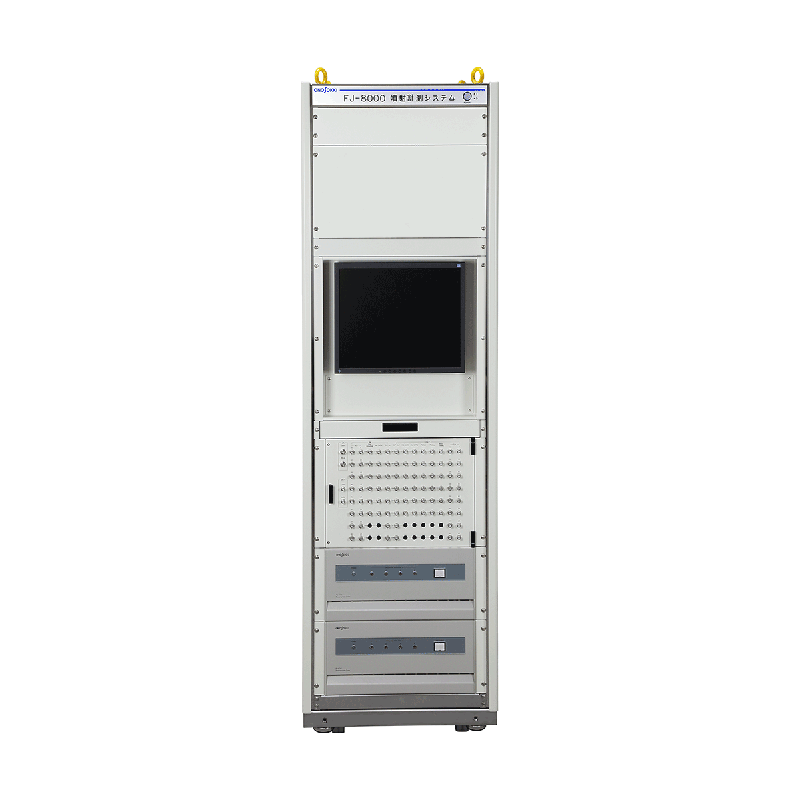
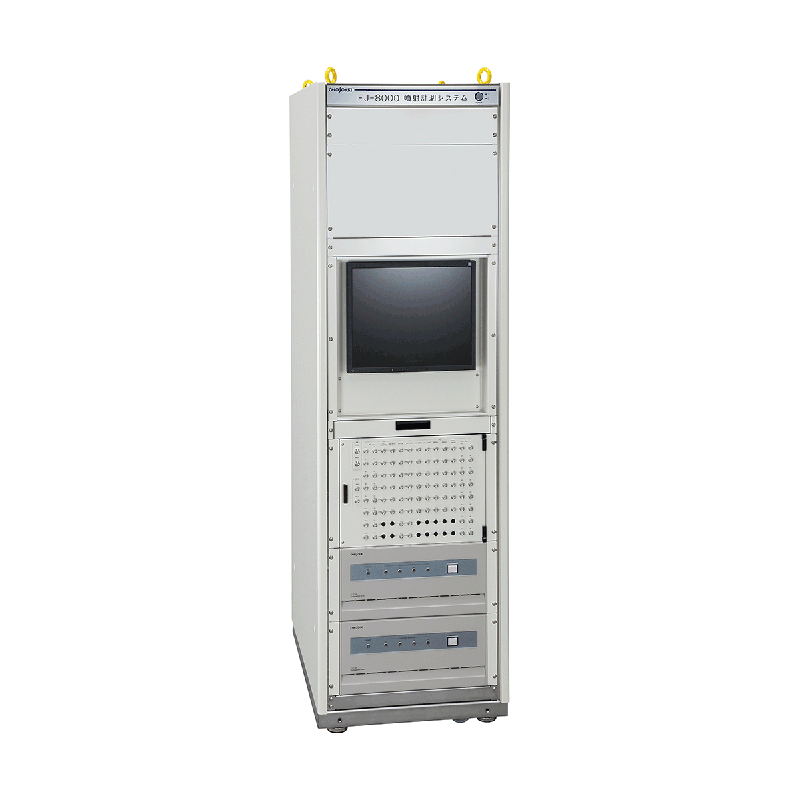
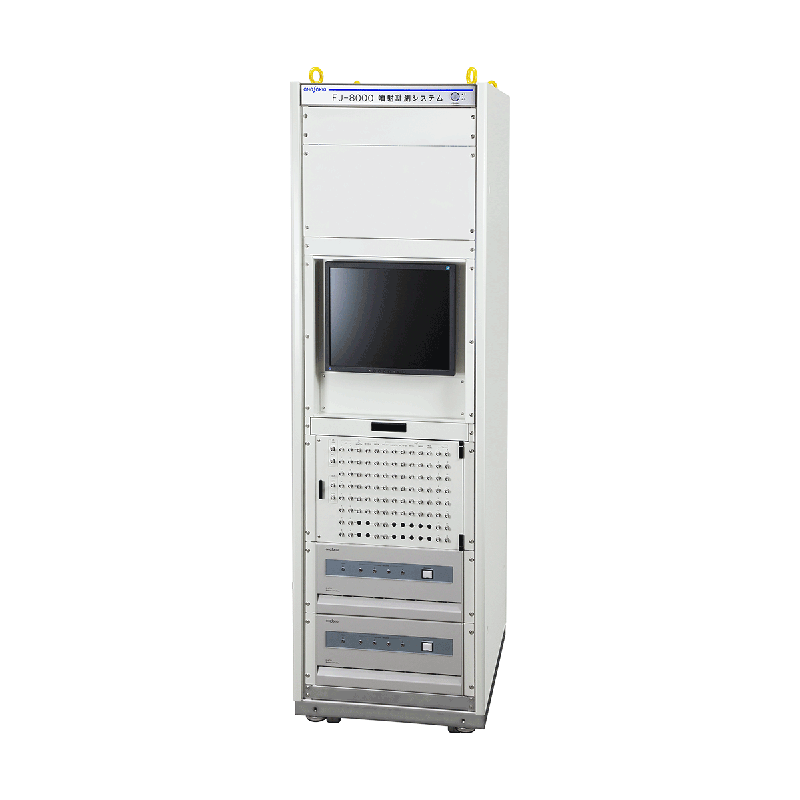
The FJ-8000 series is a multi-stage injection compatible injection quantity measurement system that can measure injection quantity, injection rate, injection timing, and injection duration in an injection environment close to real vehicle conditions using a common rail system.
By further improving injection accuracy and approaching complete combustion, it is possible to suppress the generation of PM and NOx, leading to improved fuel efficiency and reduced vibration and noise.

Features

  • High-precision multi-stage injection quantity measurement (reading value of ±0.25%) *when using the high-precision version.

  • Simultaneous measurement of injection amount and injection rate can be conducted up to a maximum of 15 stages.

  • Distortion-free injection rate waveform output using a digital filter (when using FJ-0600)

  • Simultaneous use of FJ-030 and FJ-0600 with different detection principles is possible.

  • Wide measurement range (0 to 400 mm 3 /str)

  • Continuous measurement during jetting (1 to 50 Hz [60 to 3000 r/min])

  • Up to 8 detectors can be connected.

  • Data memory for 50,000 continuous cycles.

injection amount detection unit

Achieving injection measurement close to real vehicle environment.

  • Example of a 6-cylinder layout (supports up to 8 cylinders)
    Example of a 6-cylinder layout (supports up to 8 cylinders)

High-precision injection timing analysis through high-speed sampling.

High-speed sampling (injector drive signal: 1 MHz, pressure signal: 200 kHz) allows for high-precision analysis of injection timing, including the interval until the next injection and the start/end delay times.

  • High-precision injection timing analysis through high-speed sampling.

Real-time data display

Real-time Data Display No. 1

1. Bar Graph
Displays the injection amount for each cylinder and injection stage in a bar graph.

Real-time data display No. 2

2. Injection Rate Monitor
Simultaneously displays injection rate, pressure, and external input signals from 1 channel (such as injection commands). Also supports overlaying with saved data.

Real-time data display No.3

3. Trend Graph
Displays up to 8 types of data in a trend format, with 3000 cycles.

4. Dual Monitor
Simultaneously displays trend graphs and bar graphs.

5. Numeric Monitor
Displays injection amount, injection duration, and internal detector temperature for each cylinder in numerical form.

data analysis

TQ-Q diagram (Injection command value - Injection quantity diagram)

A graph with the horizontal axis representing the injection command and the vertical axis representing the injection amount displays the change in injection amount in response to the injection command.

  • TQ-Q diagram (Injection command value - Injection quantity diagram)

Emission Rate Graph

Display the pressure waveforms, injection rate waveforms, and any waveform of 1 channel for each cycle of each cylinder.

  • Emission Rate Graph

T-Q diagram (Horizontal axis: Cycle, Vertical axis: Injection amount)

Display the variation in injection amounts for each cylinder by cycle.

N-Q diagram (horizontal axis: rotation speed, vertical axis: injection quantity)

Display of the variation in injection quantity for each cylinder based on pump rotation speed.

histogram

Display the distribution of injection amounts for the set number of injections.

statistical data

Display the average values, standard deviation, maximum/minimum values, etc., of the jetting amount, jetting duration, and temperature inside the detector.

data list

Display data such as injection amount per cycle, injection duration, and temperature within the detector in a tabular format.

System Configurations

  • System Configurations